Nifty 500 Breadth, 16 Oct 2026: An Oversold Bounce Needs More New Highs
Only about 30% of Nifty 500 stocks have RSI above 50, and new 20-day highs still trail new 20-day lows.
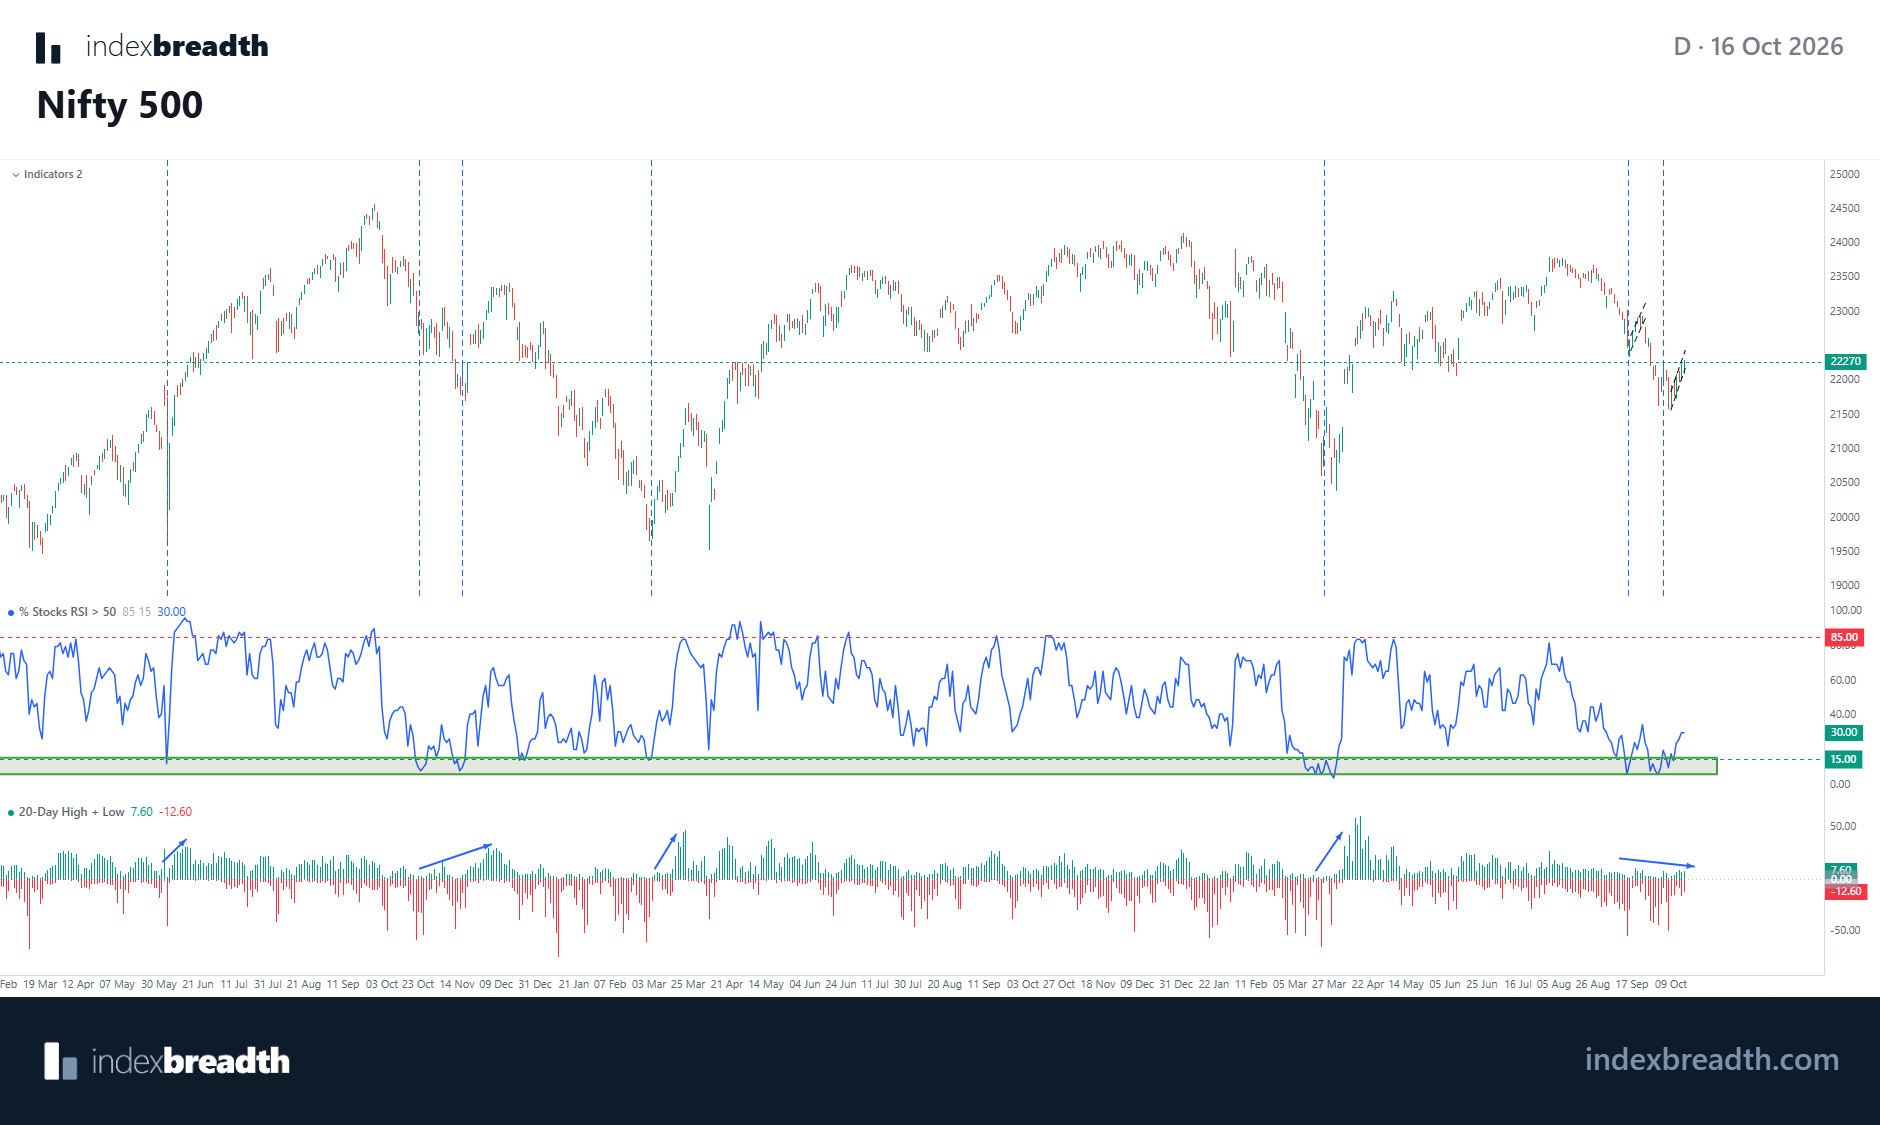
About 30% of the Nifty 500 had an RSI above 50 at the 16 Oct 2026 close. That is low, though it is up from 12.5% on 1 October. The market is bouncing from an oversold level, and my question today is whether the bounce has enough new highs behind it.
The share of stocks with RSI above 50 is still low
The middle panel of the chart shows the percentage of Nifty 500 stocks with an RSI above 50. It fell to 12.5% on 1 October, inside the shaded zone at the bottom of the panel (15% and below). In the last three years it has been at or below 15% on only about 5% of trading days, and at or below 30% on about 18% of them.
So this is a washed-out reading, even after the bounce. On the chart, the dashed vertical lines mark earlier visits to that zone, and each one sits at or near a low in the index. The reading today is around 30%, which means roughly seven in ten stocks still have RSI below 50.
The index has bounced, and the oversold group has shrunk
The Nifty 500 closed at 22,269.55. That is 1.84% higher than five sessions ago and about 3.0% above the 10-day low of 21,616.15. It is still 4.2% below its 30-day high of 23,254.15.
The share of stocks with RSI below 30 (the oversold group) has dropped from 12.6% on 9 October to 5.6% now. On 16 October, 258 stocks advanced and 241 declined, after 205 advances and 294 declines on 15 October. That is a better day, not yet a broad one.
Why I need new highs, not just a rising RSI
A rising share of stocks above RSI 50 is the first step. It tells me stocks have stopped falling. What I want to see next is stocks moving above their recent highs, because that is how a rebound shows breadth and not only relief.
The bottom panel of the chart counts new 20-day highs against new 20-day lows. Today it reads 7.6% highs and 12.6% lows, so lows are still ahead. On the 10-day measure the two are about even, at 15.6% highs and 15.0% lows.
For context, over the last year the median share of stocks at a new 10-day high is 13.2% (75th percentile 21.0%, 90th percentile 32.1%). For 20-day highs the median is 8.7% (75th percentile 14.5%, 90th percentile 22.1%). The 20-day reading of 7.6% is below its one-year median.
On the chart, the blue arrows in the bottom panel show that earlier rebounds came with the 20-day high count expanding. The arrow on the far right, for the current bounce, is flat to slightly lower. My read is that the bounce has better RSI breadth, but it does not yet have breakout participation.
| Reading (Nifty 500) | 16 Oct | 15 Oct | What it says |
|---|---|---|---|
| Stocks with RSI above 50 | about 30% | about 26% | Low, but rising from 12.5% on 1 Oct |
| Stocks with RSI below 30 | 5.6% | 6.8% | The oversold group has shrunk |
| New 10-day highs / lows | 15.6% / 15.0% | 15.8% / 18.2% | About even |
| New 20-day highs / lows | 7.6% / 12.6% | 7.0% / 16.4% | Lows still ahead, gap narrowing |
| Advances / declines | 258 / 241 | 205 / 294 | Better, not yet broad |
| Above their 20-day average | 31.4% | 29.6% | Most stocks still below short-term trend |
How I read this together
This looks like an oversold bounce in progress. The RSI breadth has recovered from a washed-out level and the new-low count has come down. The missing piece is new highs: until the 20-day highs overtake the 20-day lows, I treat the move as a rebound that has not confirmed.
The pieces fit in this order. First the share of stocks with RSI above 50 turns up from the low, which has happened. Then new lows shrink, which has partly happened. Then new highs start to outnumber new lows, which has not happened on the 20-day measure yet. To learn how each of these works, see stocks above 50 DMA explained, new highs and new lows explained and advances and declines on NSE.
What I am watching next
- New 20-day highs in the Nifty 500 moving above new 20-day lows, then toward the one-year median of 8.7%.
- New 10-day highs climbing back above 21%, the one-year 75th percentile.
- The share of stocks with RSI above 50 holding above 30% and rising, not rolling back toward 15%.
- The share of stocks above their 50-day average, now 21.2%, moving up.
- New 10-day and 20-day lows expanding again above the highs, which would put the bounce in doubt.
All readings are as of the 16 Oct 2026 close. The daily view is on the NSE market breadth today page, and both panels in the chart are available on the Nifty 500 chart in the Markets Engine tab.
Questions
What does the share of stocks with RSI above 50 measure? It is the percentage of index stocks whose RSI is above 50. A low reading means few stocks have positive momentum.
Why do new highs matter after an oversold bounce? New 10-day and 20-day highs show stocks breaking out of their recent ranges. A bounce with few new highs is mostly stocks recovering from lows.
Is an oversold reading a signal to buy? No. It describes where participation is today. It does not tell you what to do.
This is market context for study, not a signal to buy or sell.
Start your free IndexBreadth trial to follow these breadth readings across NSE universes every day.
Lovelesh Sharma
SEBI Registered RA
INH000027937
CMT, CFTe
The views expressed are for educational purposes only and do not constitute investment advice.
Tags: #MarketBreadth #Nifty500 #IndexBreadth #DailyBreadth #RSI #NewHighs