New Highs and New Lows: Reading Market Expansion
A daily advance and a new high answer different questions.

A stock can rise today and still sit far below its old high. Are stocks merely bouncing, or are more of them reaching fresh extremes? That is why I look at high–low breadth separately from daily advances and declines.
This is an introduction to public high–low calculations. StockCharts’ net-new-highs reference explains the familiar difference between new 52-week highs and lows. Our examples below are hypothetical and use a stated close-based convention.
Choose the rule before counting
Let L be the lookback in trading sessions. For an eligible stock, compare today’s comparable close with the highest and lowest closes in the previous L sessions, excluding today.
New closing high: C(t) > maximum of C(t−1)…C(t−L).
New closing low: C(t) < minimum of C(t−1)…C(t−L).
We use strict inequalities, so matching the previous extreme does not count as a fresh one in this lesson. That is a declared convention, not a claim that every data vendor uses it.
A daily intraday-high/low definition is different from a closing-price definition. Similarly, a fixed trading-session window is not exactly the same as a calendar 52-week window. Those choices must be consistent before two readings are compared.
From individual stocks to breadth
Call the number of qualifying new highs H and new lows Lw. Let E be the eligible universe count for the chosen window.
Net new highs = H − Lw.
Net-high percentage = 100 × (H − Lw)/E, for E > 0.
We use Lw for the low count here so it is not confused with the lookback L.
Imagine 200 eligible NSE stocks, of which 24 make new closing highs and six make new closing lows. Net new highs are 24 − 6 = +18. As a share of the universe, the net margin is 18 ÷ 200 × 100 = +9%.
The new-high share alone is 12%; the new-low share is 3%. Adding those two shares does not have to produce 100%. Most stocks can be between the extremes.
Two markets with the same net reading
Here is a comparison I find useful:
| Hypothetical session | New highs | New lows | Net |
|---|---|---|---|
| A | 24 | 6 | +18 |
| B | 60 | 42 | +18 |
The same net value hides very different activity. Session B has many more stocks reaching both sides of the range. I would inspect the separate counts before describing the market as uniformly strong.
For our single closing-price convention, one stock cannot be strictly above the previous maximum and below the previous minimum at the same time. Do not carry that conclusion over blindly to intraday range-based measures.
Interpretation and limitations
A sustained excess of new highs describes expansion at the selected horizon. A contraction in new lows can be encouraging during a recovery, but it is not proof that a bottom is in.
After a deep decline, stocks can rally substantially while remaining below their long-lookback highs. New-high breadth may therefore tell a different story from short-term participation. That disagreement can be informative rather than an error.
I think the essential checks are the lookback, price basis, equality rule and coverage. On IndexBreadth, start with the displayed labels and selected universe. For the basic daily count underneath other indicators, see advances, declines and unchanged.
Reading the IndexBreadth charts
Here is the IndexBreadth view labelled 52W High + Low (Both), alongside Nifty 500 price. The marked version highlights how the displayed bars expand and contract across rallies and declines. I would read both sides of the display rather than focus on a single headline number.
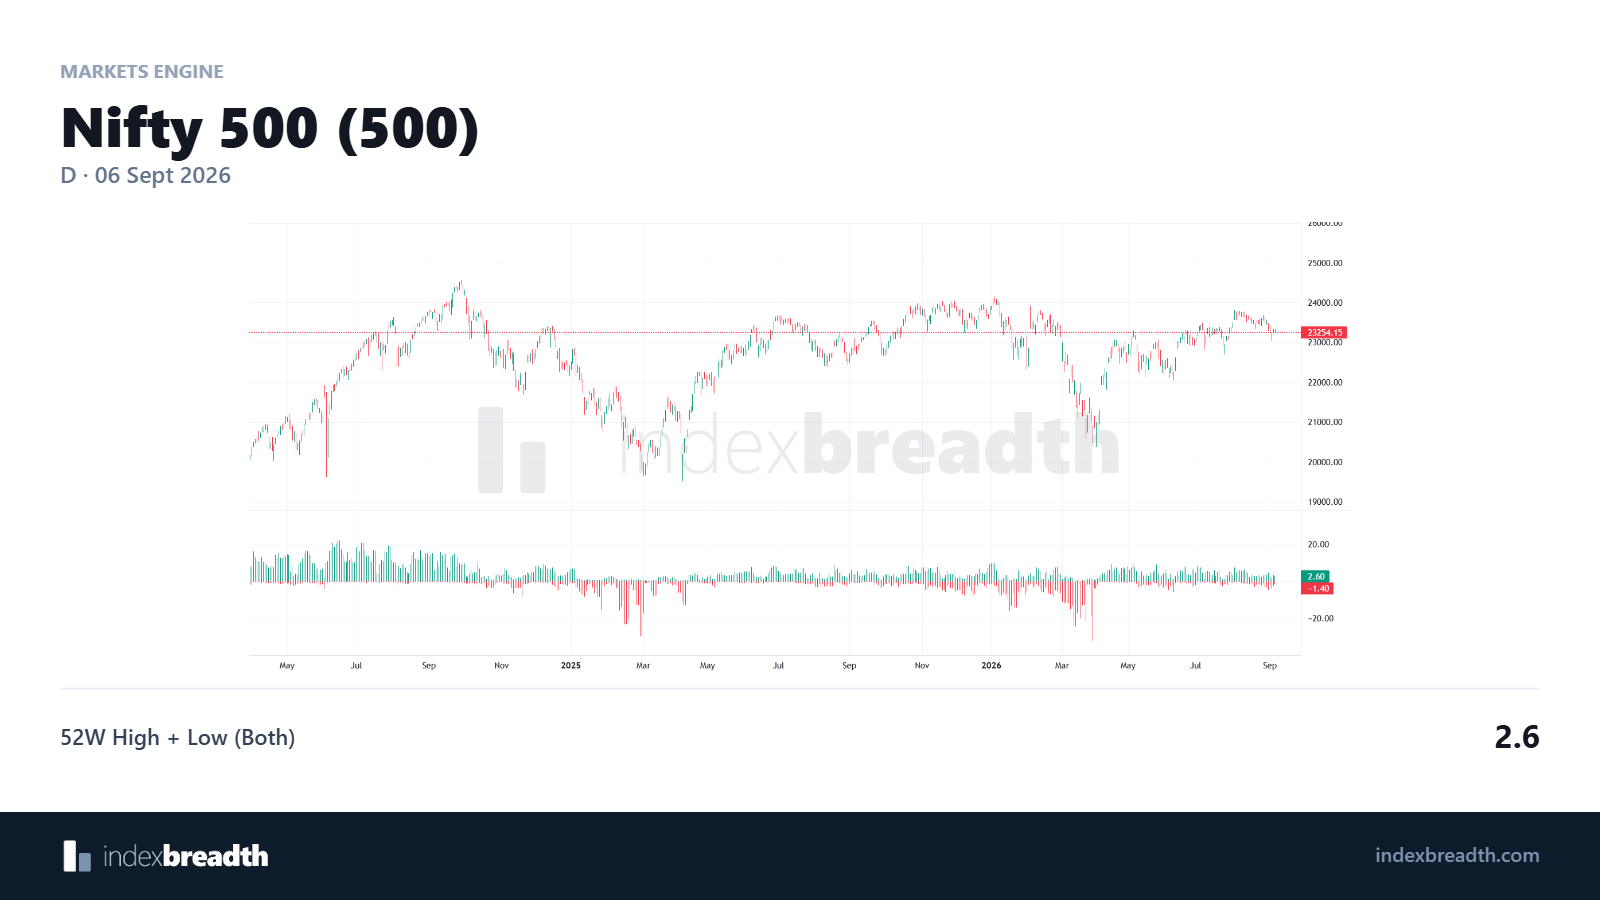
The original chart places the high-low display beneath the index.
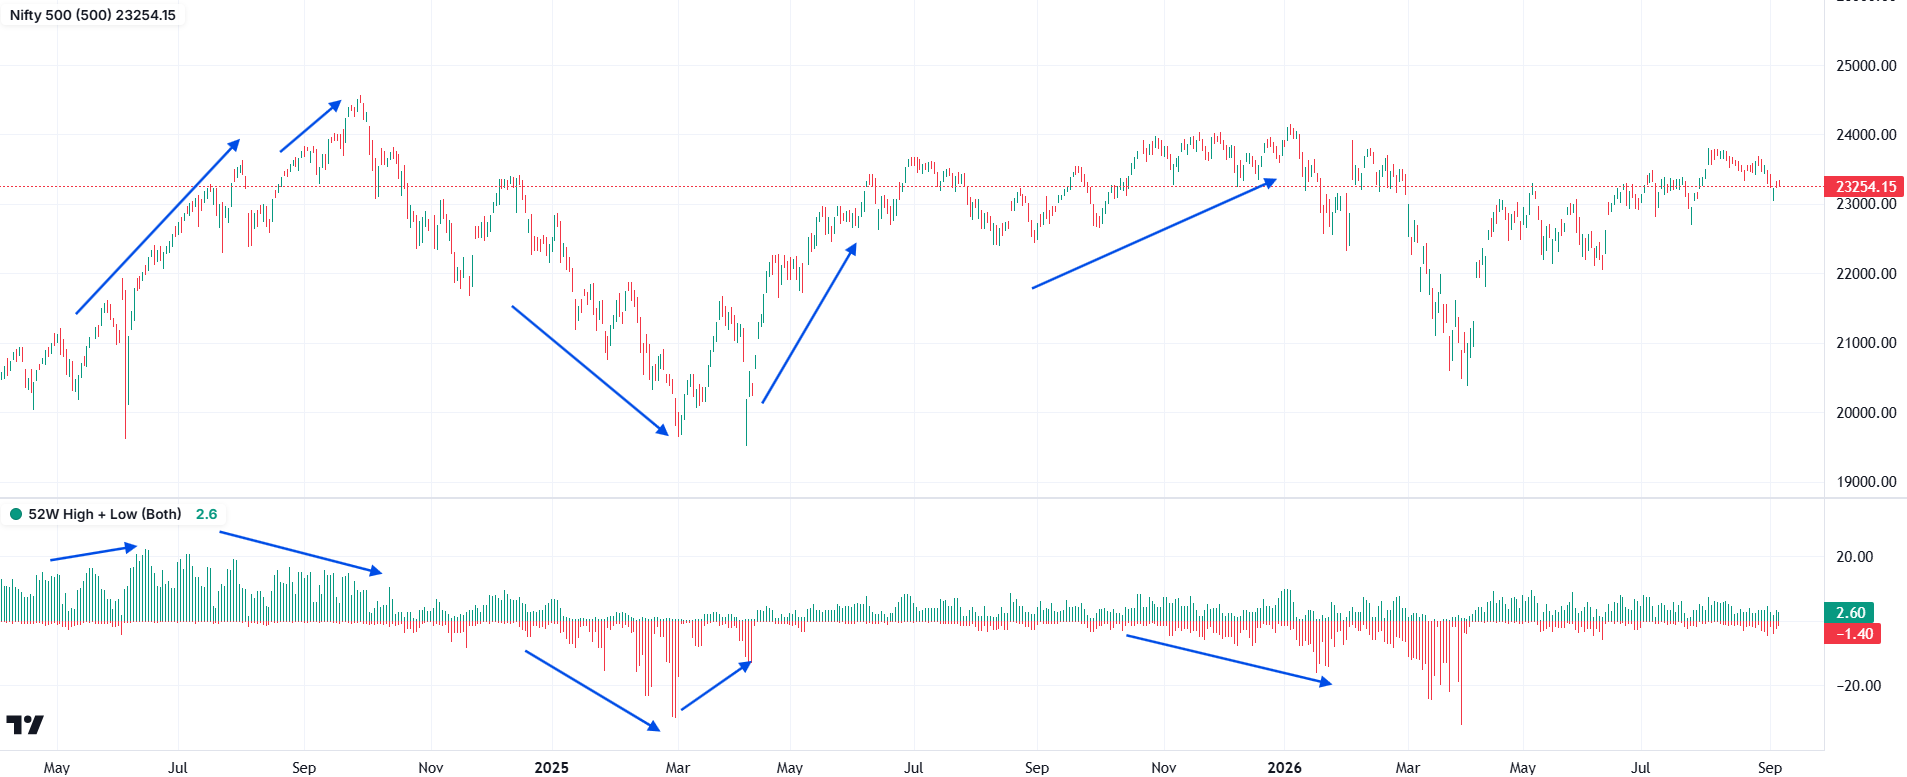
The annotations highlight the relationship between price direction and changes in the displayed bars.
Charts: IndexBreadth. Select an image to view it at full size. These are historical illustrations, separate from the worked numerical examples in this lesson.