Muhurat Trading Returns: What 19 Nifty 50 Sessions Show (2006-2024)
The Muhurat session closed green 14 times in 19, but a year later the Nifty 50 looked like it does after any other date.
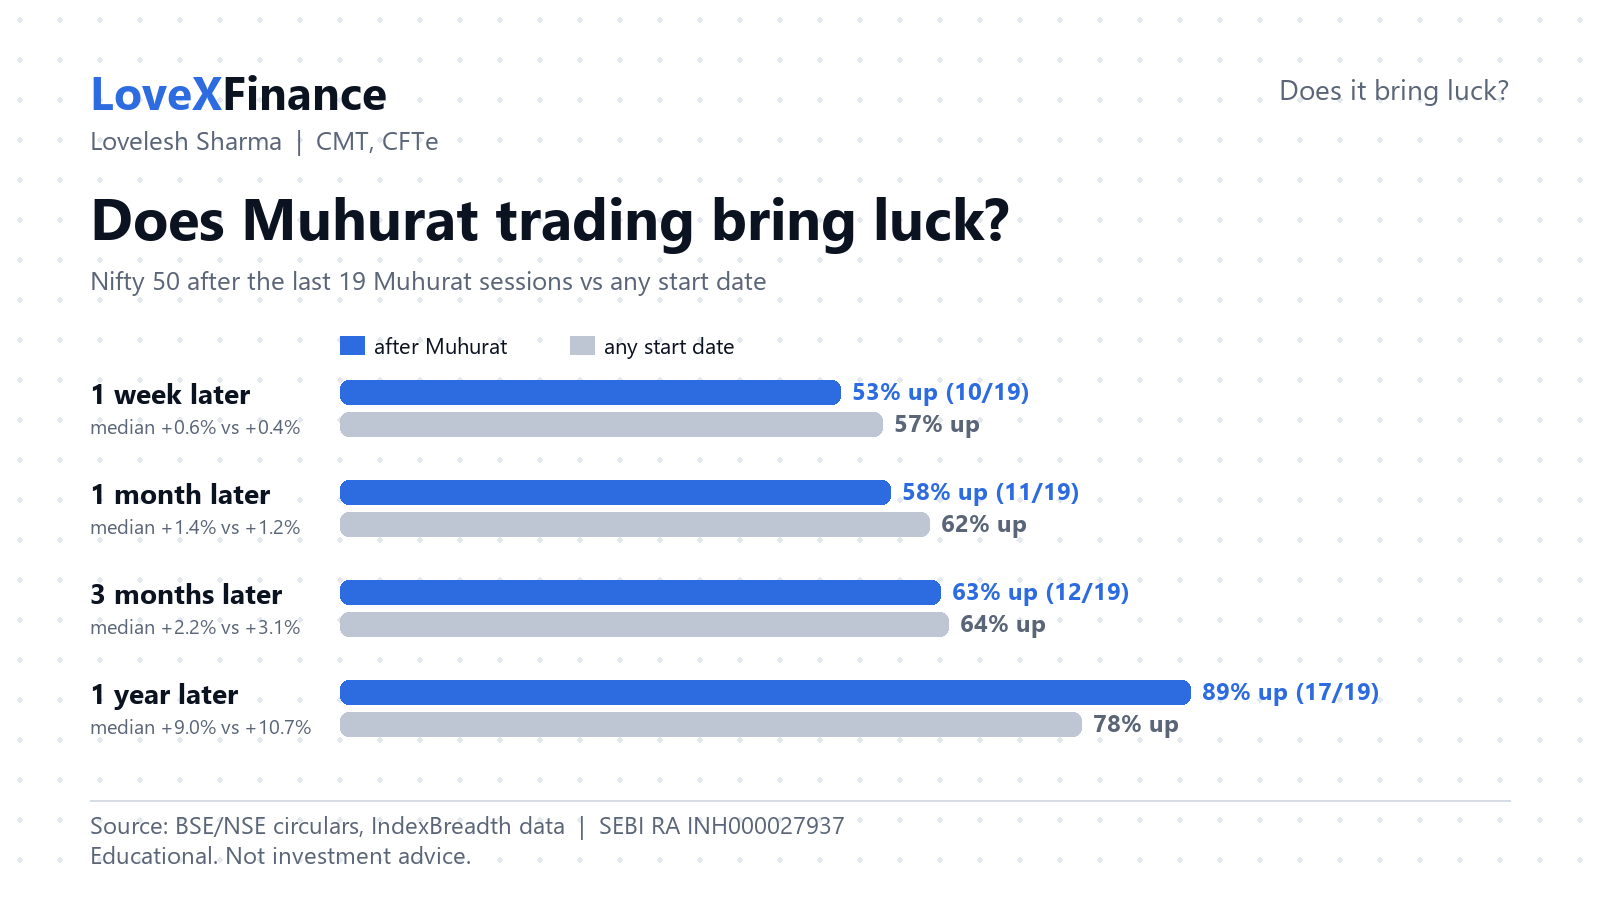
This year’s Muhurat trading session is on Sunday 8 November 2026, from 2:20 pm to 3:30 pm. Every Diwali the same question comes up: does the session, or the days after it, tell us anything? I checked the Nifty 50 across the last 19 Muhurat sessions, from 2006 to 2024, and my answer is: the session itself leans green, but what follows looks like any other date.
The 2026 schedule
BSE and NSE announced the session in circulars on 19 October 2026. A block deal session runs from 1:50 pm to 2:05 pm, the pre-open session from 2:05 pm to 2:20 pm, and continuous trading from 2:20 pm to 3:30 pm, which is 70 minutes. In pre-open, limit and market orders are allowed from 2:05 pm to 2:10 pm, only limit orders from 2:10 pm to 2:15 pm, and order matching runs from 2:15 pm to 2:17 pm. Last year the session was held in the afternoon too, from 1:45 pm to 2:45 pm, instead of the traditional evening slot.
The session itself: small and mostly green
The Nifty 50 closed green in 14 of the 19 Muhurat sessions and red in 5. The last 7 sessions, from 2018 to 2024, all closed green. The typical move is small: the median session change is about +0.4%. The biggest gain was +6.35% in 2008, in the middle of the global financial crisis, and the biggest fall was -0.63% in 2017. For comparison, an ordinary trading day closes green about 53% of the time, so the Muhurat session does lean positive, but it is one hour with very small moves.
After the session: nothing special
For the days after, I measured from the Muhurat session close and compared with every other start date in the Nifty 50 data since 2006.
| Time after Muhurat | Up after Muhurat | Median return | Any start date: up | Any start date: median |
|---|---|---|---|---|
| 1 week | 10 of 19 (53%) | +0.6% | 57% | +0.4% |
| 1 month | 11 of 19 (58%) | +1.4% | 62% | +1.2% |
| 3 months | 12 of 19 (63%) | +2.2% | 64% | +3.1% |
| 1 year | 17 of 19 (89%) | +9.0% | 78% | +10.7% |
A week after Muhurat the Nifty 50 was up about as often as a coin flip, and a month and three months later it was up slightly less often than after a random date. The one-year number is higher (17 of 19), but the one-year figure for any start date is also high (78%), and the median one-year return after Muhurat (+9.0%) is lower than the median for any start date (+10.7%). So Muhurat start dates behave like any other date.
All 19 sessions
| Muhurat date | Session close | Session change | 1 week later | 1 month later | 1 year later |
|---|---|---|---|---|---|
| 21 Oct 2006 | 3,683.50 | +0.18% | +1.5% | +4.7% | +41.6% |
| 09 Nov 2007 | 5,663.25 | -0.62% | +4.3% | +5.5% | -47.5% |
| 28 Oct 2008 | 2,684.60 | +6.35% | +17.0% | +2.5% | +79.8% |
| 17 Oct 2009 | 5,141.80 | -0.01% | -2.8% | -1.6% | +17.9% |
| 05 Nov 2010 | 6,312.45 | +0.48% | -3.8% | -5.1% | -16.3% |
| 26 Oct 2011 | 5,201.80 | +0.19% | +1.1% | -9.5% | +9.7% |
| 13 Nov 2012 | 5,666.95 | -0.29% | -1.7% | +3.3% | +5.7% |
| 03 Nov 2013 | 6,317.35 | +0.16% | -2.8% | -1.8% | +31.8% |
| 23 Oct 2014 | 8,014.55 | +0.23% | +1.9% | +5.8% | +3.5% |
| 11 Nov 2015 | 7,825.00 | +0.53% | -1.2% | -2.7% | +9.0% |
| 30 Oct 2016 | 8,625.70 | -0.14% | -2.2% | -5.6% | +20.1% |
| 19 Oct 2017 | 10,146.55 | -0.63% | +1.9% | +1.4% | +1.5% |
| 07 Nov 2018 | 10,598.40 | +0.65% | -0.2% | +0.9% | +13.3% |
| 27 Oct 2019 | 11,627.15 | +0.37% | +2.3% | +3.5% | +1.2% |
| 14 Nov 2020 | 12,780.25 | +0.47% | +0.6% | +6.1% | +41.6% |
| 04 Nov 2021 | 17,916.80 | +0.49% | -0.2% | -4.0% | +1.1% |
| 24 Oct 2022 | 17,730.75 | +0.87% | +1.6% | +3.0% | +8.7% |
| 12 Nov 2023 | 19,525.55 | +0.51% | +1.1% | +7.1% | +23.6% |
| 01 Nov 2024 | 24,304.35 | +0.40% | -0.6% | -0.7% | +5.8% |
Session close and session change are for the Muhurat session itself. Later returns use the Nifty 50 close that many calendar days after the session (the last close on or before that day).
Patience, a long-term view and behaviour
I read three things in this table, and none of them is about the date.
Patience. The short window is noise. A week after Muhurat the Nifty 50 was up in only 10 of 19 years, close to a coin flip. A year later it was up in 17 of 19. That pattern is true for any start date: the index was higher after one week 57% of the time and after one year 78% of the time. The longer you look, the more the odds change.
A long-term view. The same ritual led to opposite years. The Nifty 50 was 47.5% lower a year after the 2007 Muhurat session and 79.8% higher a year after the 2008 session, which came right at the bottom of the global financial crisis. Nobody could have read that from the date. Years like these are why a long-term view matters more than a start date.
Behaviour. Fear and greed decide more outcomes than any calendar date. The investors who struggle are usually the ones who buy because it is a good day on the calendar and sell because the screen is red. A ritual is a nice way to start a new year of investing, but discipline and patience are what matter after that. These are historical results for study, not instructions.
What I will look at on 8 November
I will look at breadth going into the session: how many stocks sit above their 20-day average, how new 20-day highs compare with new 20-day lows, and how many stocks rose against fell. A Muhurat session is only one hour, and the market’s participation going into it tells me more than the date does. To learn how each of these works, see stocks above 50 DMA explained, new highs and new lows explained and advances and declines on NSE.
Questions
When is Muhurat trading in 2026? On Sunday 8 November 2026, from 2:20 pm to 3:30 pm, after a block deal session at 1:50 pm and a pre-open session at 2:05 pm, according to the BSE and NSE circulars.
Does Muhurat trading bring good returns? The Nifty 50 closed green in 14 of 19 Muhurat sessions, with a typical gain of about 0.4%. The returns after the session look the same as after any other date.
Is Muhurat trading a signal to buy? No. It is a tradition. The data shows no edge after the session, and this article is market context for study, not advice.
Sources: BSE and NSE circulars (19 Oct 2026) for the 2026 session; session data for the Muhurat sessions of 2006 to 2024; IndexBreadth daily index data for the returns after each session. Past returns are not a guide to future returns.
This is market context for study, not a signal to buy or sell.
Start your free IndexBreadth trial to follow market breadth across NSE universes every day.
Lovelesh Sharma
SEBI Registered RA
INH000027937
CMT, CFTe
The views expressed are for educational purposes only and do not constitute investment advice.
Tags: #MuhuratTrading #Diwali #Nifty50 #MarketBreadth #LongTermInvesting