Daily Market Breadth, 27 Oct 2026: Are New Lows Fading in the Nifty 500 and Nifty 50?
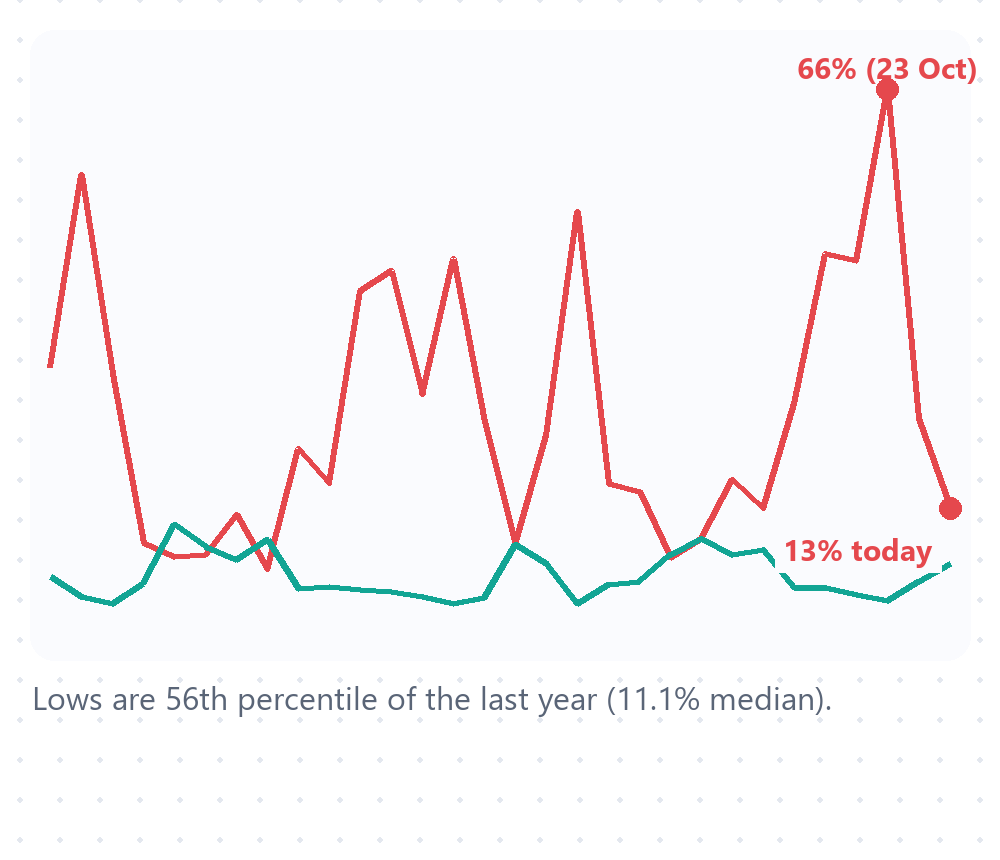
New 20-day lows fell to 12.8% of Nifty 500 stocks from a 65.6% peak four sessions ago, but only 24.6% of stocks are above their 20-day average.
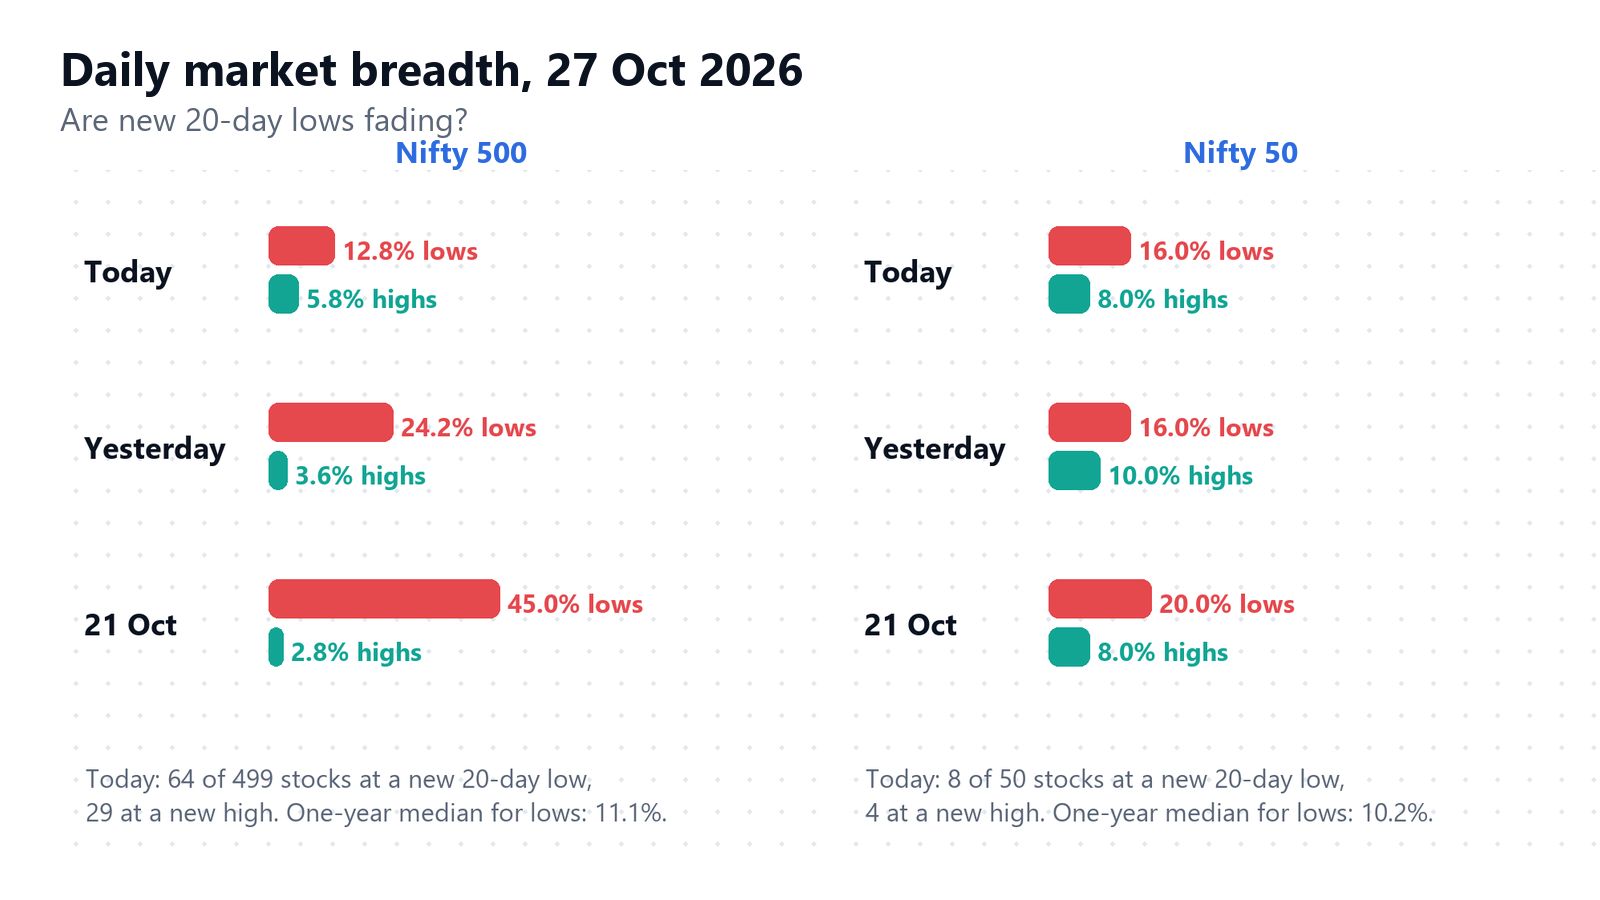
The Nifty 500 closed at 21,734.60 on 27 October 2026, up 0.58%. The more interesting number sits under the index: new 20-day lows fell to 12.8% of stocks (64 of 499), after 65.6% on 23 October. That is the question I am asking today: are new lows fading, or is this a pause inside a wider fall? I look at it with two readings. One is the share of stocks at a new 20-day high or low. The other is the share of stocks above their 20, 50 and 200-day averages.
Reading 1: new 20-day lows and highs
A stock is at a new 20-day low when it closes below the lowest close of the previous 20 sessions. The share of stocks doing that tells us how widely a fall is spreading.
| Nifty 500 | 27 Oct | 26 Oct | 23 Oct |
|---|---|---|---|
| New 20-day lows | 12.8% (64 stocks) | 24.2% | 65.6% |
| New 20-day highs | 5.8% (29 stocks) | 3.6% | 1.2% |
| Advances / declines | 352 / 147 | 337 / 163 | 40 / 460 |
On 23 October, two-thirds of the index closed at a new 20-day low. Four sessions later, the figure is 12.8%, close to its one-year median of 11.1% (56th percentile). New highs are still thin at 5.8%, below the one-year median of 8.5%. So lows have calmed down, but highs have not taken over.
The index closed 1.4% above its 20-day closing low of 21,427.60 and 2.4% below its 20-day high of 22,270.05.
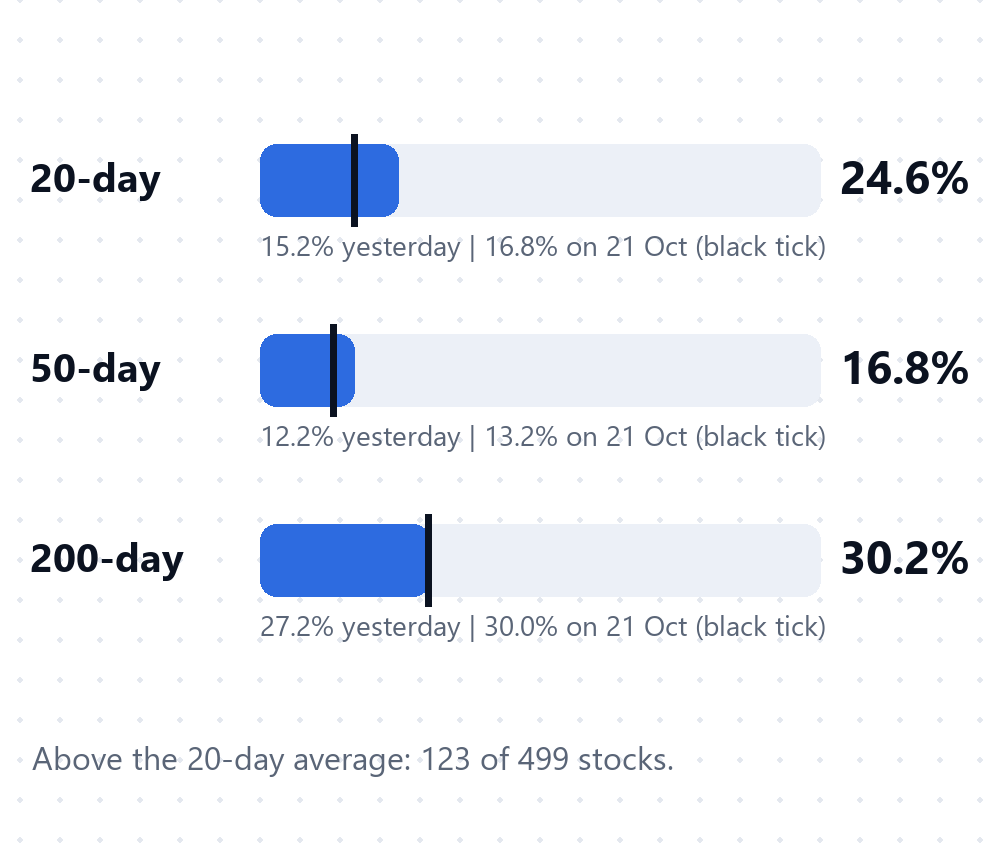
Reading 2: how many stocks are above their averages
| Nifty 500, share of stocks above their | 27 Oct | 26 Oct | 21 Oct | One-year median |
|---|---|---|---|---|
| 20-day average | 24.6% | 15.2% | 16.8% | 42.1% |
| 50-day average | 16.8% | 12.2% | 13.2% | 46.9% |
| 200-day average | 30.2% | 27.2% | 30.0% | 47.2% |
All three shares rose today. The 20-day share jumped from 15.2% to 24.6%, which is 123 of 499 stocks. But every one of them is still below its one-year median, and the 50-day share (16.8%) sits at only the 4th percentile of the last year. The question: is this the start of a recovery in participation, or a one-day bounce? One session cannot answer that.
Nifty 50: the same questions
| Nifty 50 | 27 Oct | 26 Oct | 23 Oct |
|---|---|---|---|
| New 20-day lows | 16.0% (8 stocks) | 16.0% | 34.0% |
| New 20-day highs | 8.0% (4 stocks) | 10.0% | 2.0% |
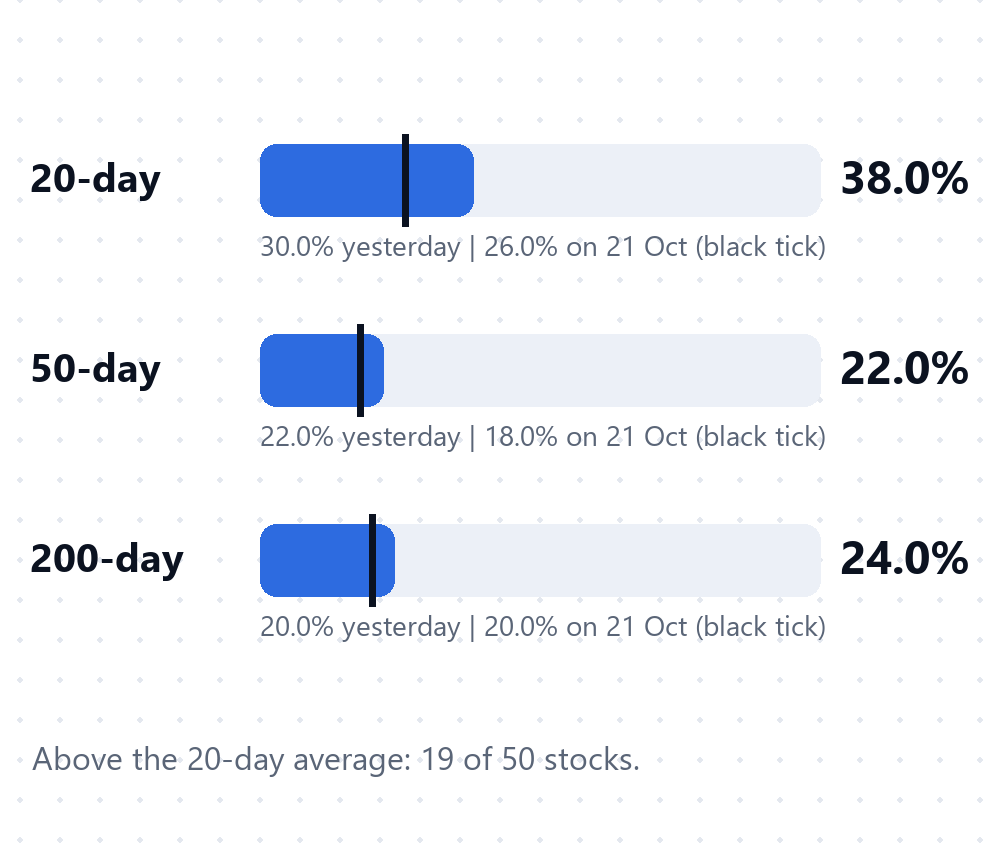
| Above 20-day average | 38.0% | 30.0% | 20.0% |
| Above 50-day average | 22.0% | 22.0% | 16.0% |
| Above 200-day average | 24.0% | 20.0% | 14.0% |
The Nifty 50 closed at 22,749.75, almost flat at -0.02%, with 25 advances and 25 declines. New 20-day lows are at 16.0% (66th percentile of the last year), down from 34.0% on 23 October and from a 60% peak on 8 October. The share above the 20-day average, 38.0%, is close to its one-year median of 44.9%, but the 50-day share (22.0%, 18th percentile) and the 200-day share (24.0%, 8th percentile) are still low. The large stocks look steadier than the wider market, though they are not strong across the longer averages.
How I read the two together
Both readings point the same way for the short term: lows are shrinking and more stocks are back above their 20-day average. They also agree on what is missing: new highs are small, and the 50 and 200-day shares are still low. A recovery that lasts usually needs the highs to grow and the longer averages to turn up, not only the lows to shrink. That is why I treat today as a question and not an answer.
What I am watching next
- Do new 20-day lows in the Nifty 500 stay below 25% of stocks?
- Does the share above the 20-day average keep rising?
- Do new 20-day highs grow past 10%?
- Does the Nifty 500 hold above its 20-day closing low of 21,427.60?
All readings are as of the 27 Oct 2026 close. The daily view is on the NSE market breadth today page, and the cards for both indices are posted on our social channels. To learn how each reading works, see stocks above 50 DMA explained and new highs and new lows explained.
Questions
What does “new 20-day low” mean? It is a stock closing below the lowest close of its previous 20 sessions. The percentage shows how many stocks in the index did that on the same day.
What does “stocks above the 20-day average” measure? It is the percentage of an index’s stocks trading above their own 20-day average price. A low number means few stocks are in a short-term uptrend.
Does a falling count of new lows mean the market will rise? No. It describes how widely the weakness is spreading today. It does not predict what happens next.
This is market context for study, not a signal to buy or sell.
Start your free IndexBreadth trial to follow these breadth readings across NSE universes every day.
Lovelesh Sharma
SEBI Registered RA
INH000027937
CMT, CFTe
The views expressed are for educational purposes only and do not constitute investment advice.
Tags: #MarketBreadth #Nifty500 #Nifty50 #NewLows #DailyBreadth