Nifty 50 Breadth: Seven Negative Sessions—Rebound Watch
Daily Market Breadth · 8 September 2026 · The marked history puts the latest −7 streak in focus.
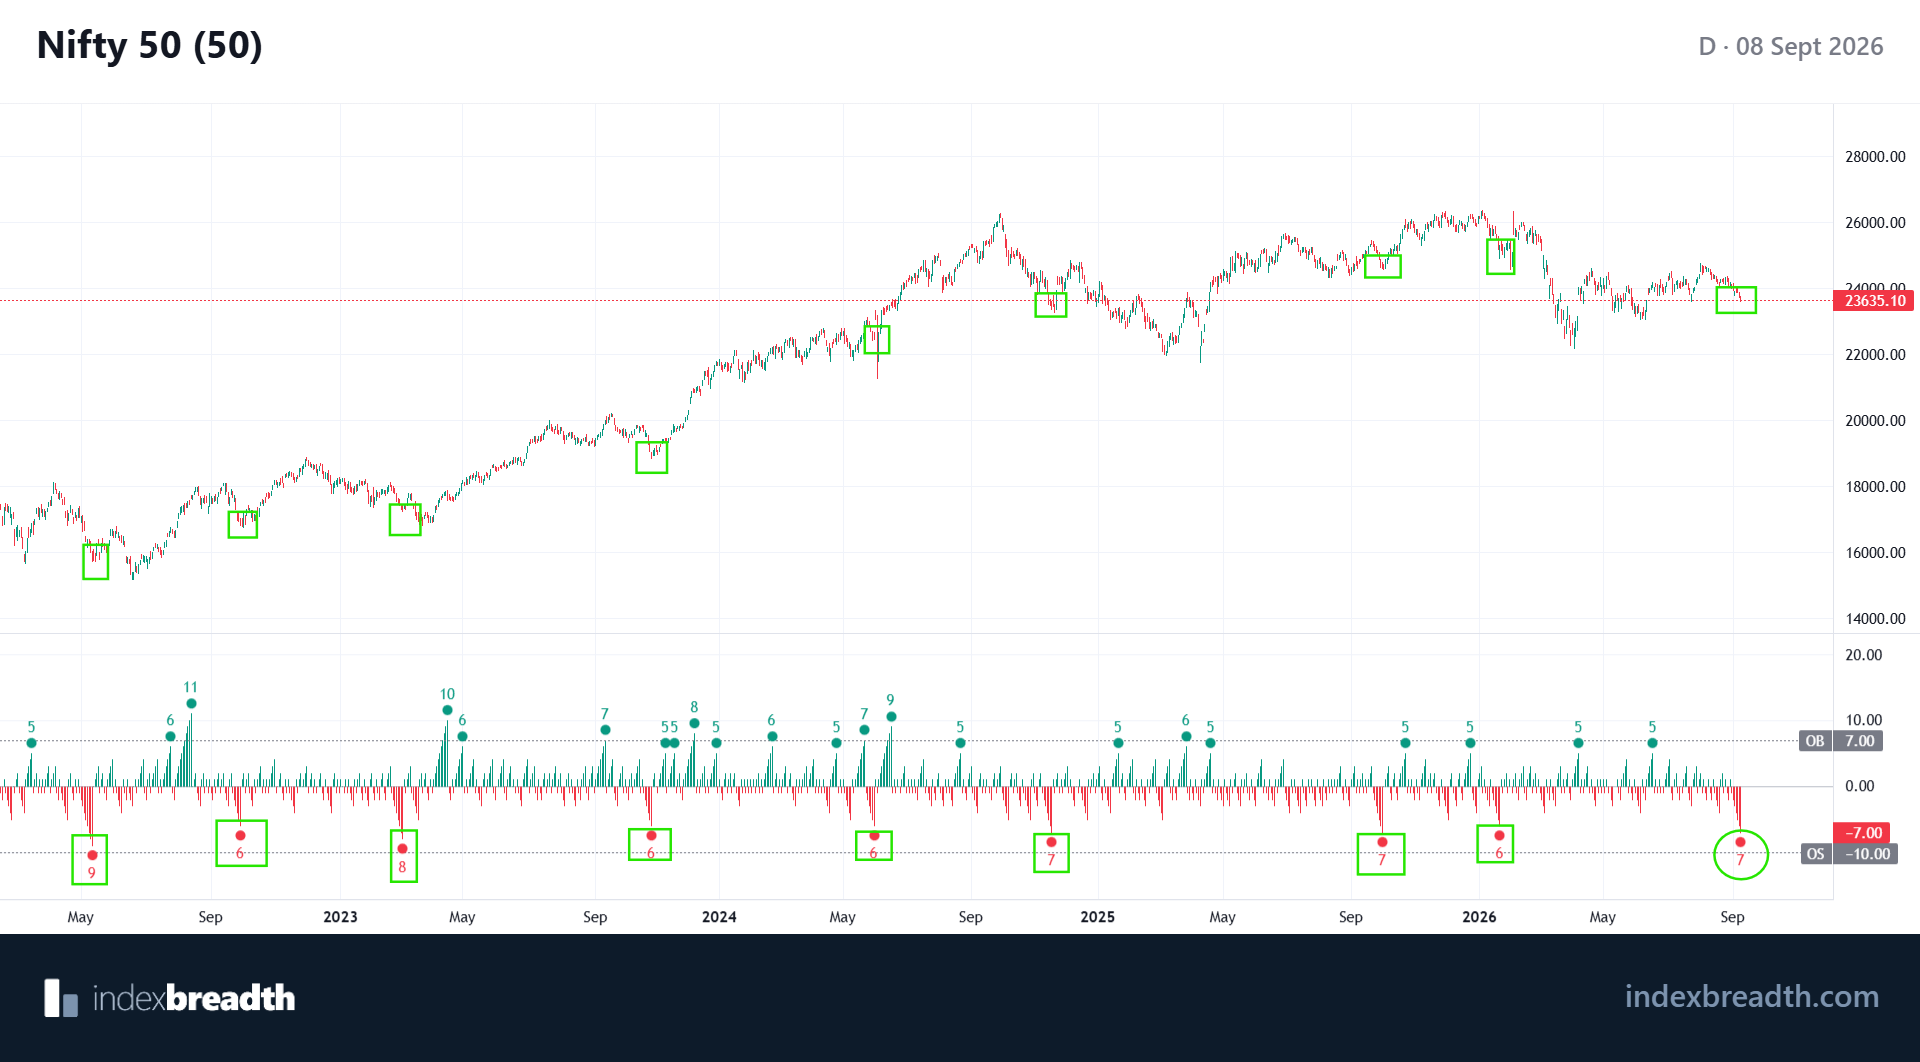
Seven consecutive negative breadth sessions have brought Nifty 50 back to a reading worth watching.
What catches my attention in our marked IndexBreadth chart is the history around these extended negative stretches. The highlighted historical examples were followed by rebounds, although the wait and the size of those moves varied. The latest reading is now −7, putting this stretch beyond six consecutive negative breadth sessions.
Open the marked chart at full size.
Source: the supplied IndexBreadth Nifty 50 chart, daily timeframe, dated 8 September 2026. Green boxes mark historical comparisons; the latest negative streak is circled. This is a reading of the supplied snapshot, not a separately verified closing-price report.
What the marked history is showing
The negative streak labels highlighted in the lower panel include six, seven, eight and nine sessions. Corresponding green boxes in the price panel help us compare what happened around those stretches.
I think that comparison is the interesting part: prolonged negative breadth has appeared around areas from which price subsequently bounced in the selected examples. The chart also shows why the distinction between a rebound and a lasting reversal matters. An initial recovery does not necessarily end the broader period of weakness.
The green markings are selected historical observations, not an exhaustive backtest. I would describe them as a recurring rebound pattern in the examples shown, rather than an established “every time” rule.
Today’s reading: seven negative sessions
The latest Breadth Streaks value is −7. That is a streak reading—not a seven-percent decline in the index, and not a claim that every Nifty 50 constituent fell for seven sessions.
The current occurrence sits at the right edge of the chart. Its outcome is still unfolding; it cannot be counted as another successful historical rebound.
What I am watching next
My focus is whether the negative run starts to ease and price begins to recover. Improvement in breadth alongside a price response would add support to the rebound case. Continued negative breadth with further price weakness would leave that case waiting for evidence.
The historical comparison gives me a reason to pay attention here. It does not give an exact rebound date, target or expected return. Those would require a defined study of every qualifying streak, including how much further price fell before any recovery and whether the rebound lasted.
For this update, the observation is straightforward: Nifty 50 has reached seven consecutive negative breadth sessions, and the marked historical rebounds make the next response worth following.
Explore the previous Daily Market Breadth update for the earlier cross-index snapshot, or start an IndexBreadth trial to follow the available market views.