Market Breadth EOD: 7 September 2026
Five-day breadth changes: large and midcaps weaken, while small caps improve.
7 September 2026 · EOD · Compared with five daily bars earlier
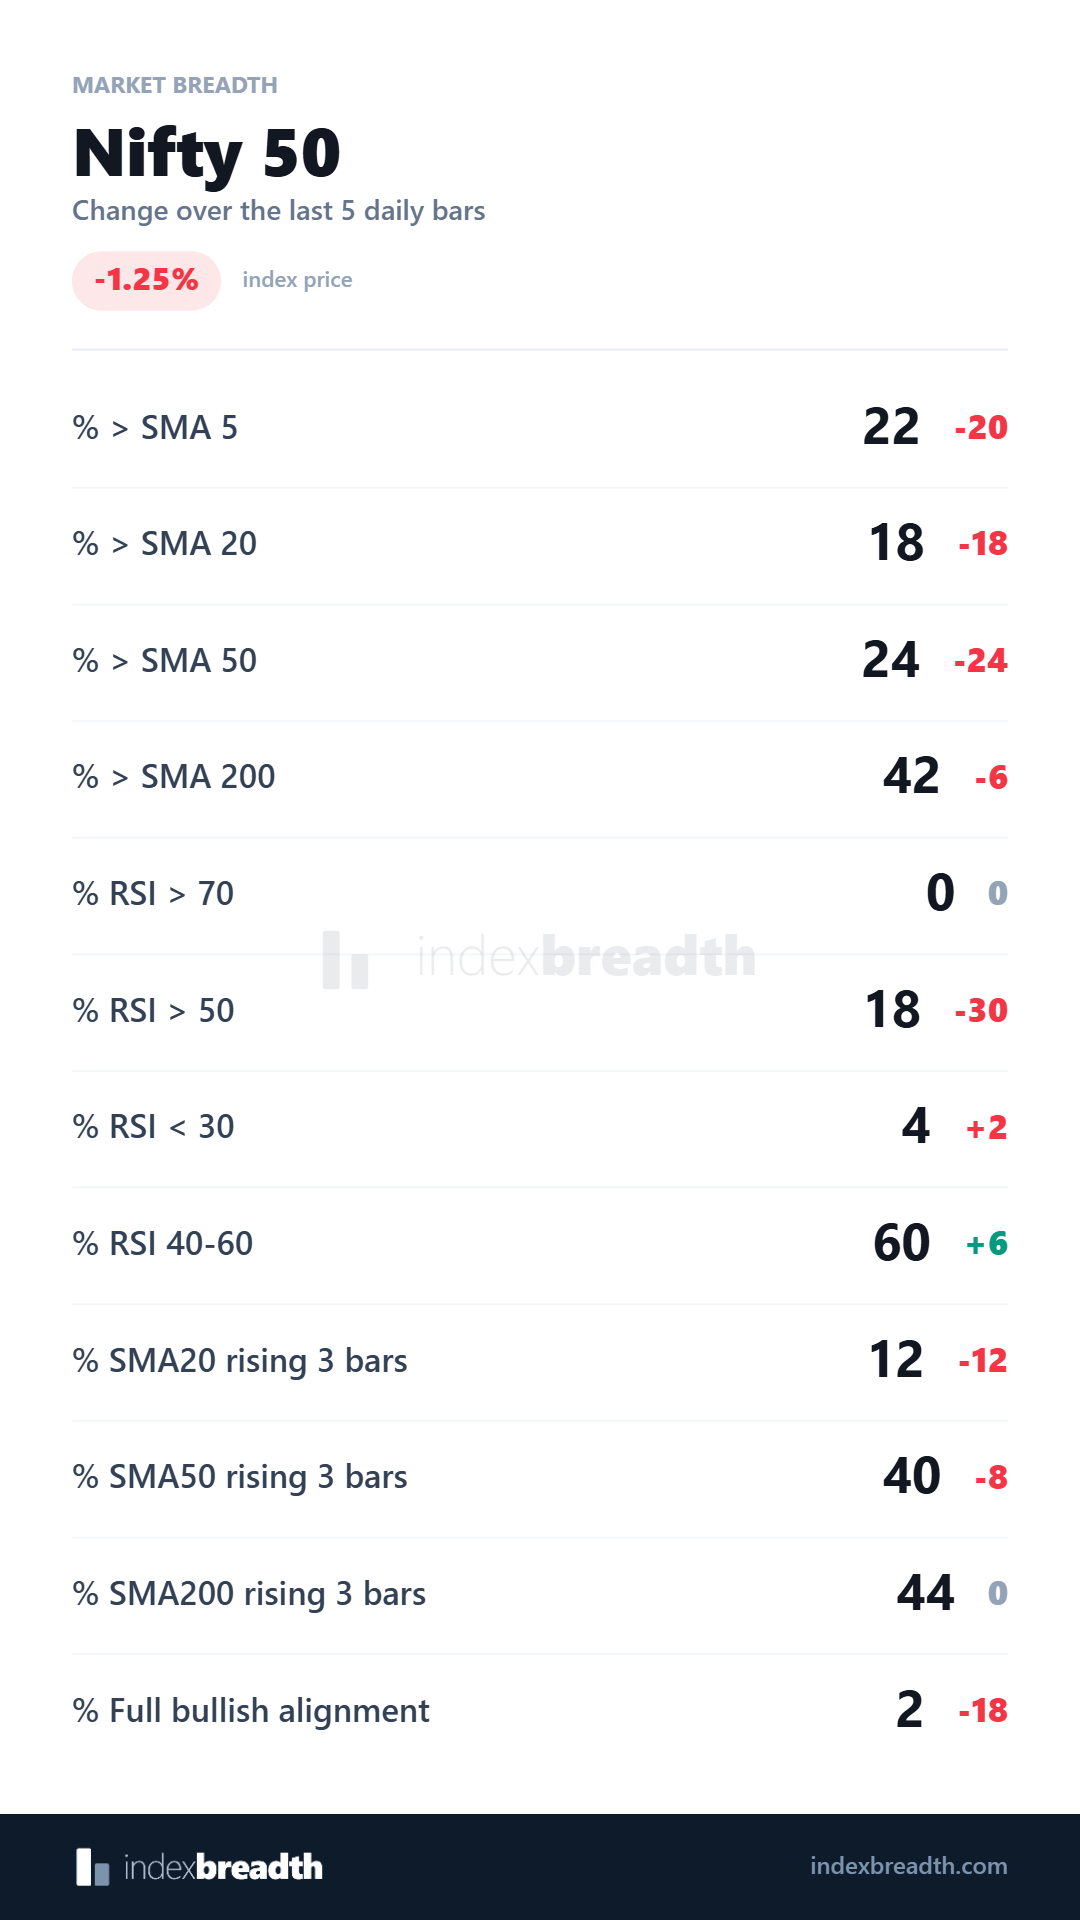
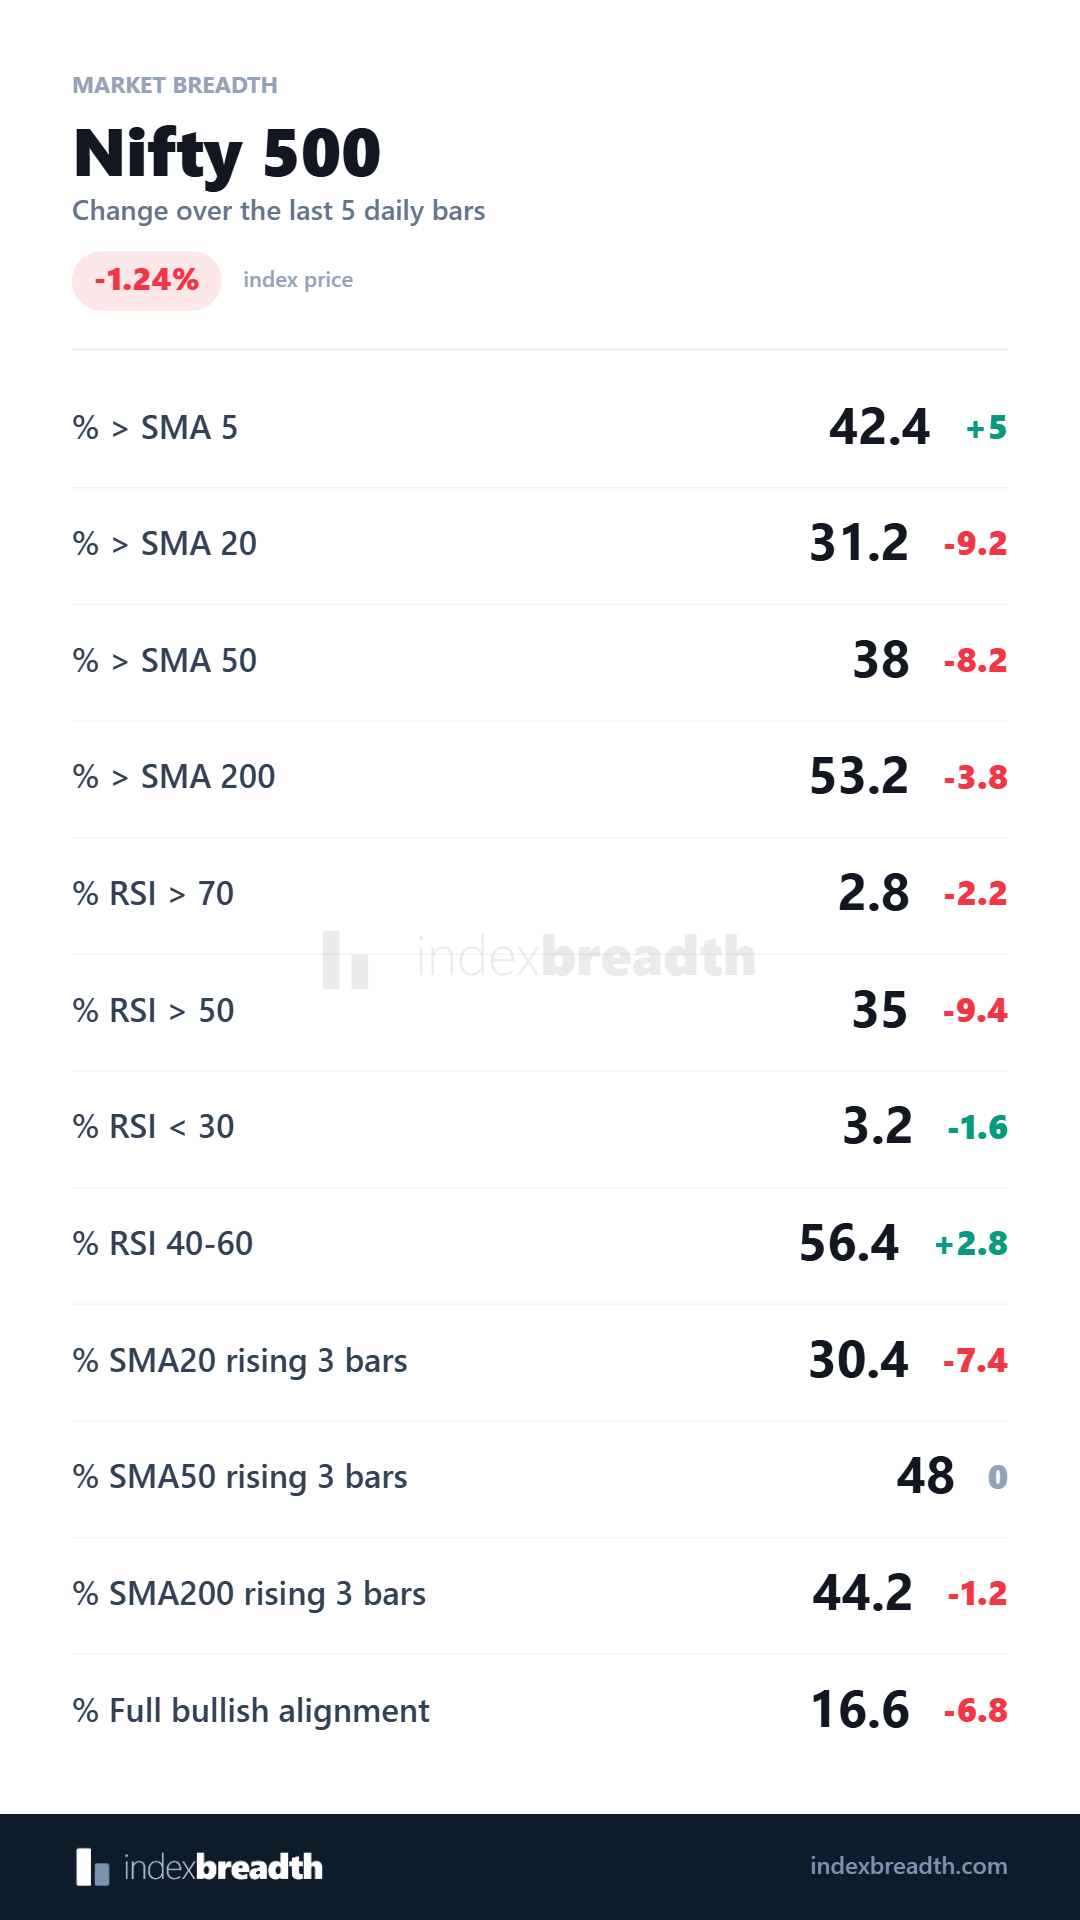
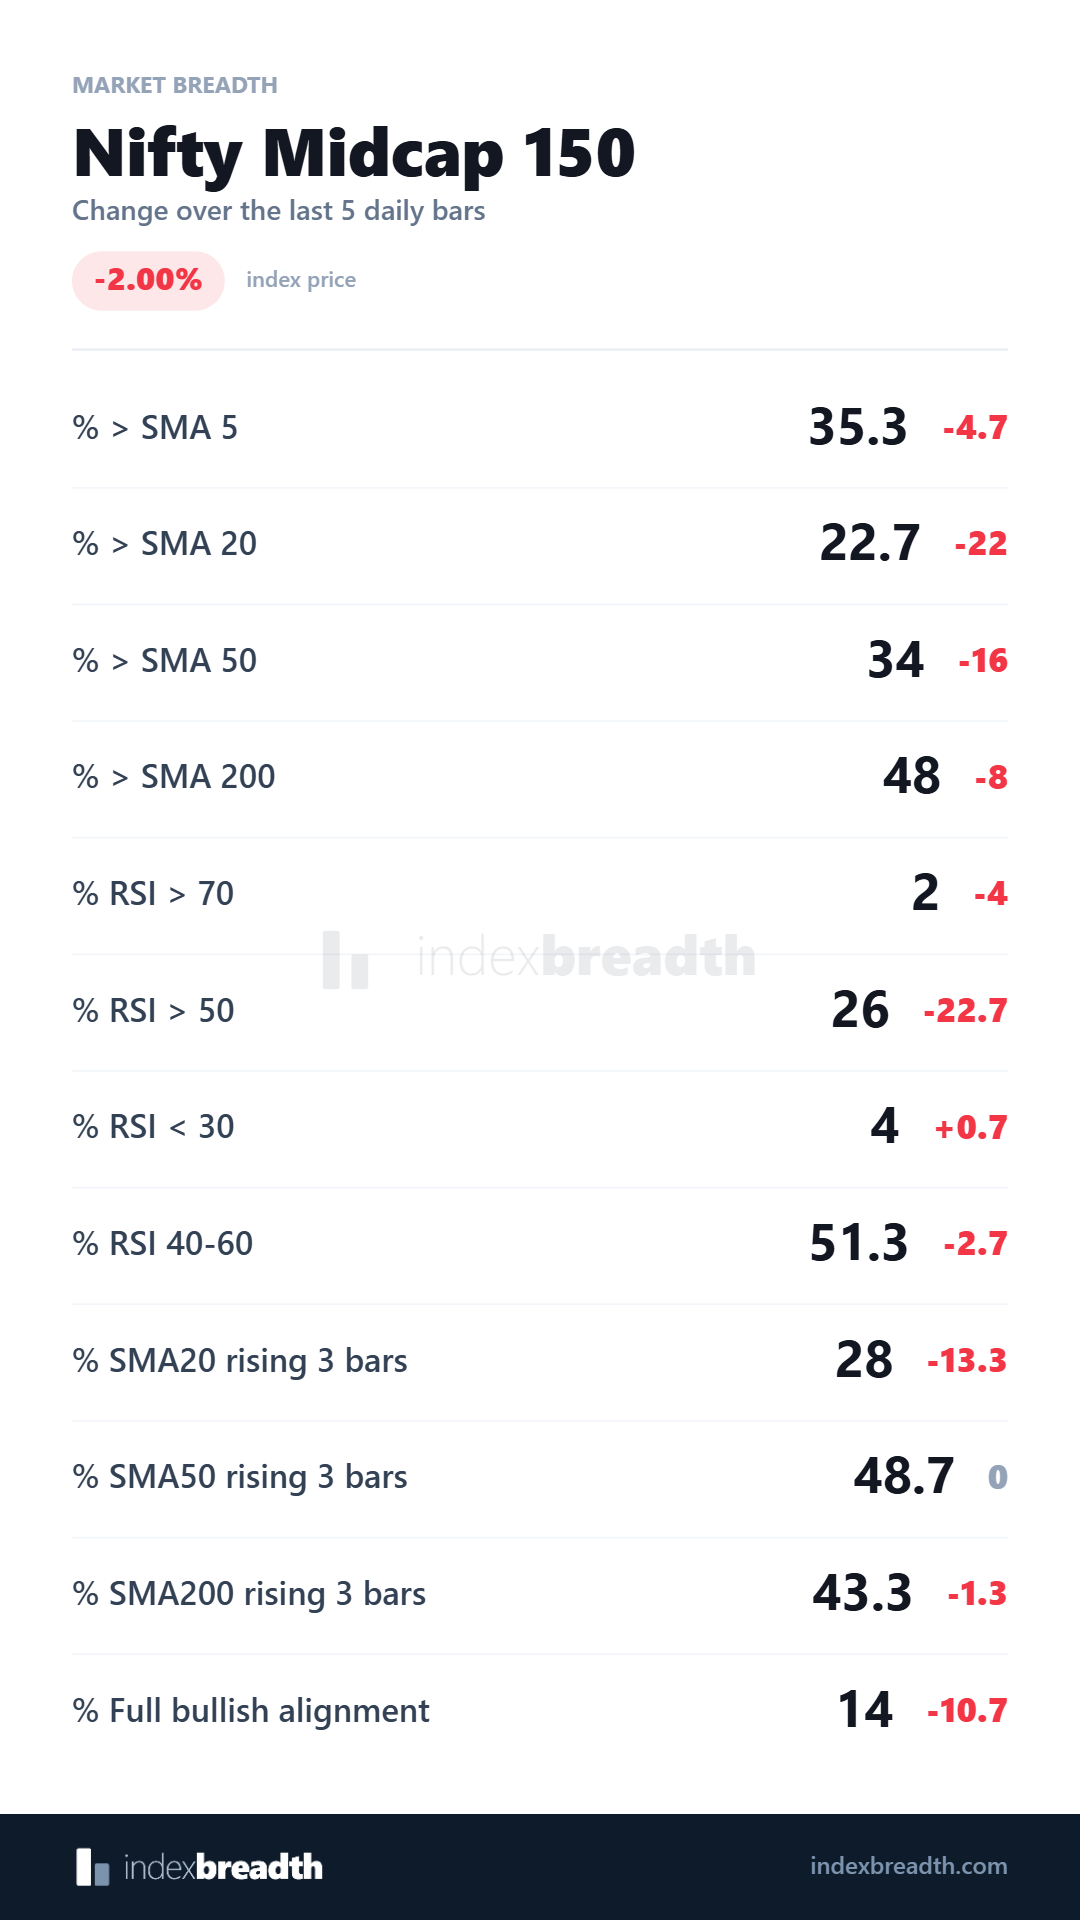
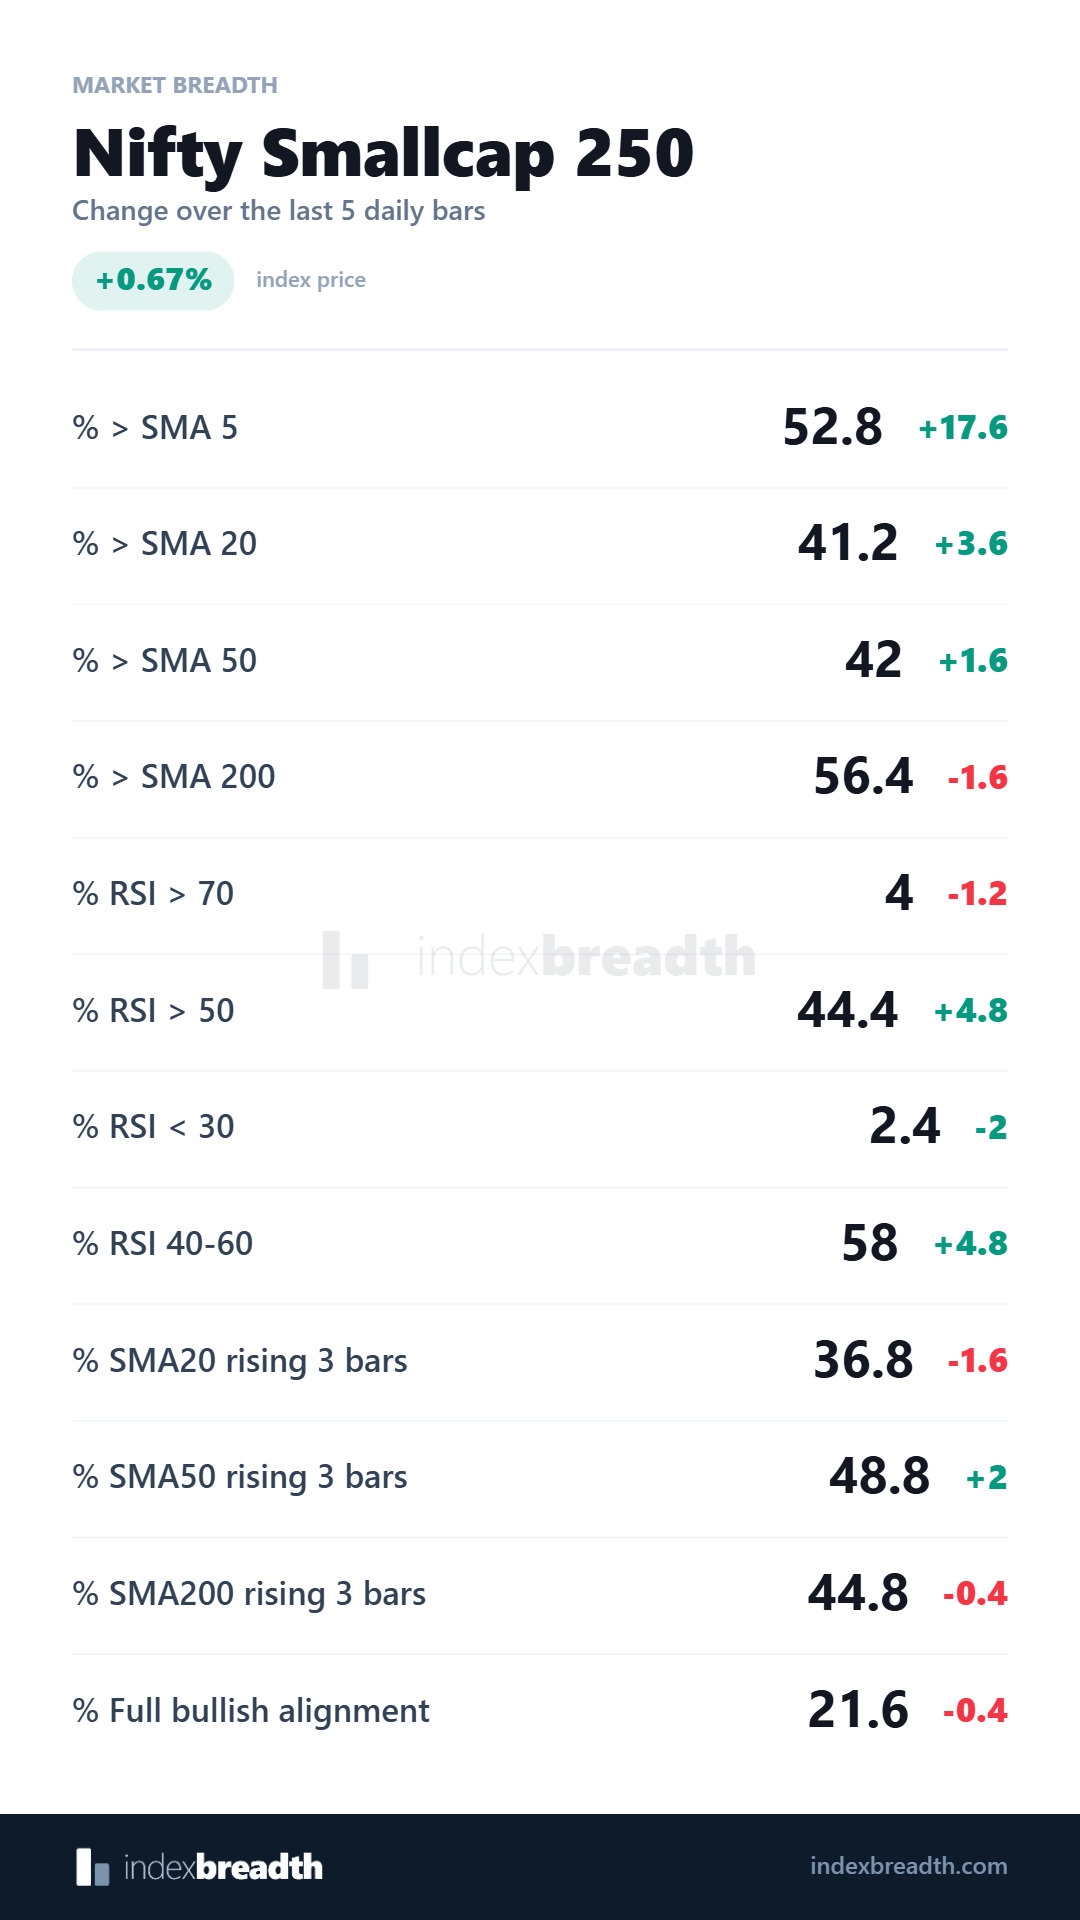
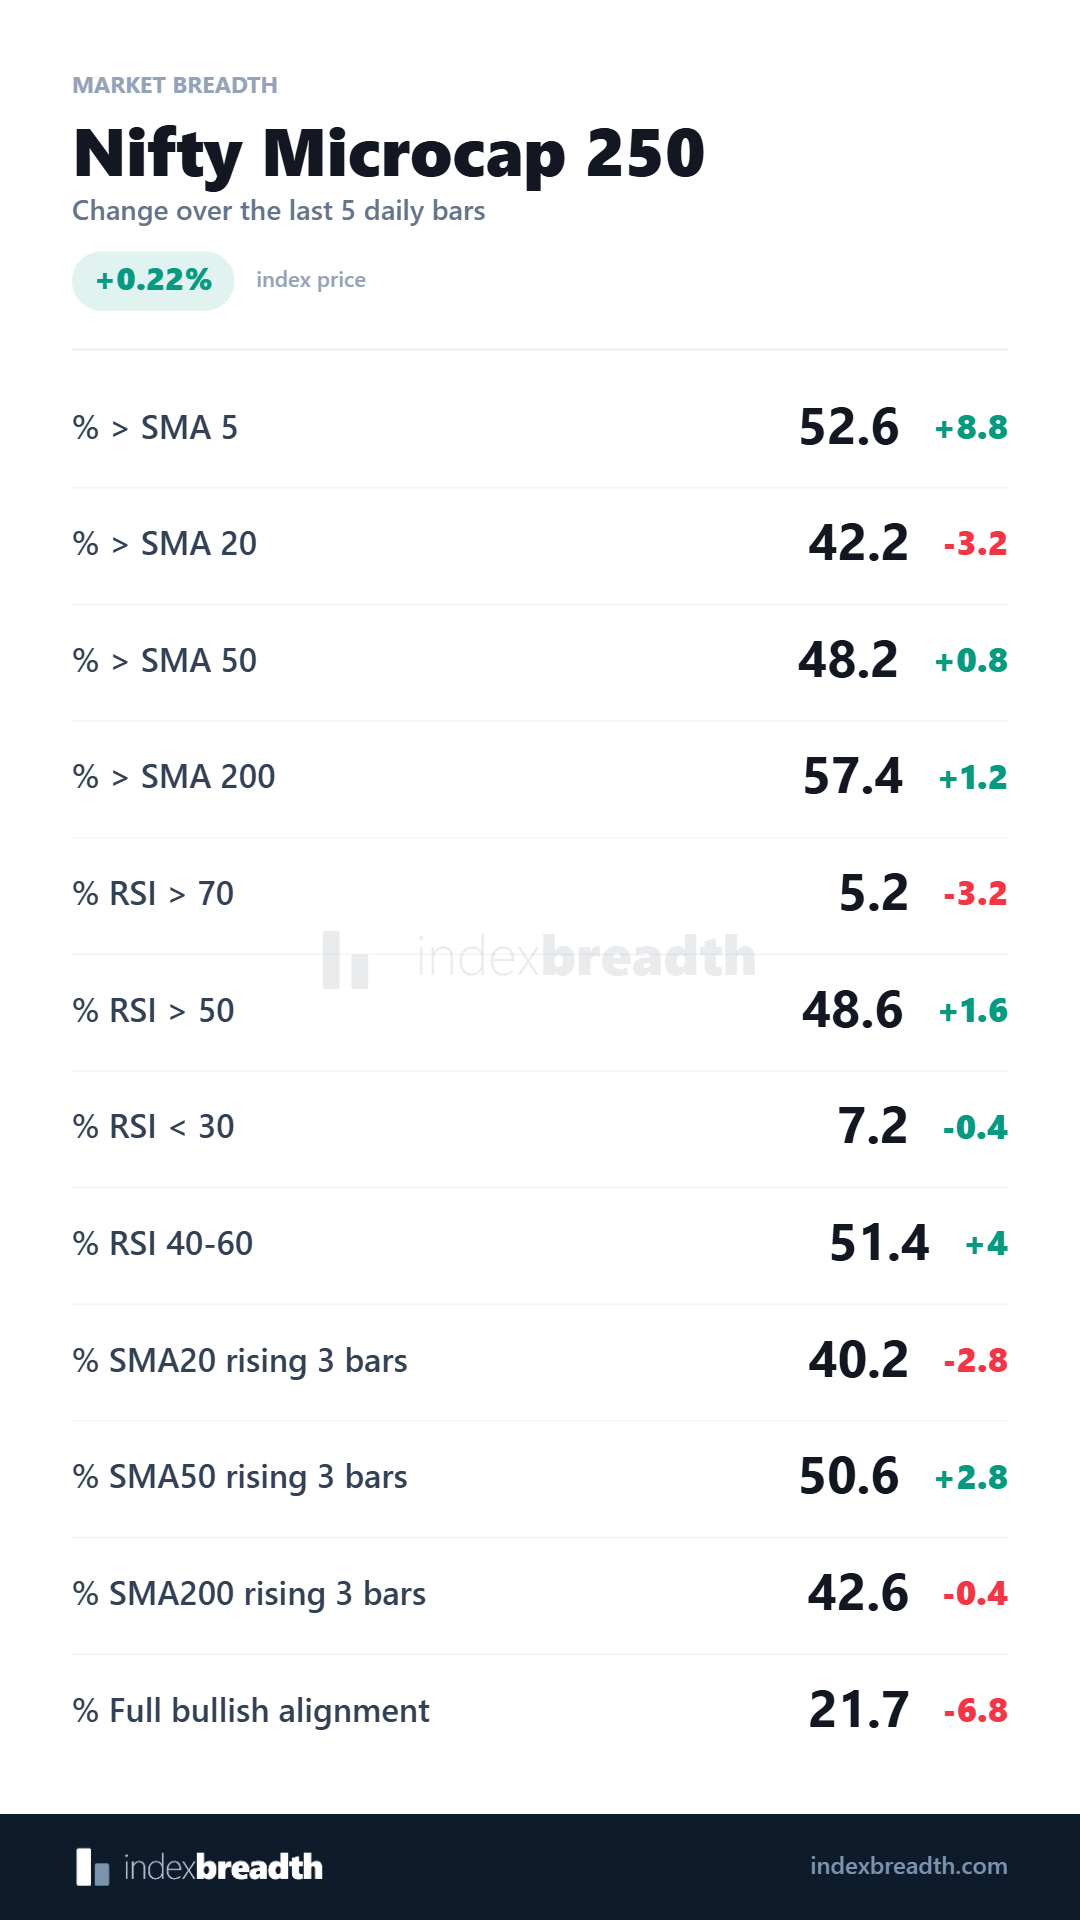
What stands out to me is the split beneath the index moves. Large- and mid-cap participation weakened, while small caps improved. Microcaps held up better on price too, although their breadth recovery was mixed.
Five-day breadth cards
Swipe left to see the next card, scroll right, or choose an index below. Tap a card to open the full-size image.
The main figures are the current breadth percentages. Their changes are in percentage points (pp); the index-price change is a percentage return over the same five-bar window.
Nifty 50
Nifty 500
Nifty Midcap 150
Nifty Smallcap 250
Nifty Microcap 250
My EOD reading
Small caps show the clearest improvement in shorter-term participation in this set. Even there, fewer than half the stocks were above their 20- or 50-day averages. I see improving participation, with more ground still to recover.
Nifty 50 and midcaps tell a weaker story: both lost substantial participation alongside falling prices. Nifty 500 shows a better 5-day reading, but its longer-lookback participation measures declined. Microcaps sit between the two, with improvement in several readings and weakness in the 20-day measure.
What I’ll watch next
I’m watching whether the small-cap improvement spreads into stronger 20- and 50-day participation, and whether Nifty 50 and midcaps begin to regain lost participation. In microcaps, the useful next check is whether the 20-day reading starts to catch up.
Explore the readings in Market Snapshot, compare groups in Breadth Matrix, and use Markets Engine to examine them alongside the index chart. LVB offers a separate view of price and participation rotation.
Open IndexBreadth · Start with Breadth Analysis 101
Source: the five IndexBreadth EOD cards for 7 September 2026. This compares the latest readings with five daily bars earlier; it is not a day-by-day series.