Weekly Market Breadth, 23 Oct 2026: All 5 Broad Indices and 23 of 24 Sectors Fell
Nifty 500 and Smallcap 250 had their biggest weekly fall in 26 weeks, and only IT of 24 sectors held up.
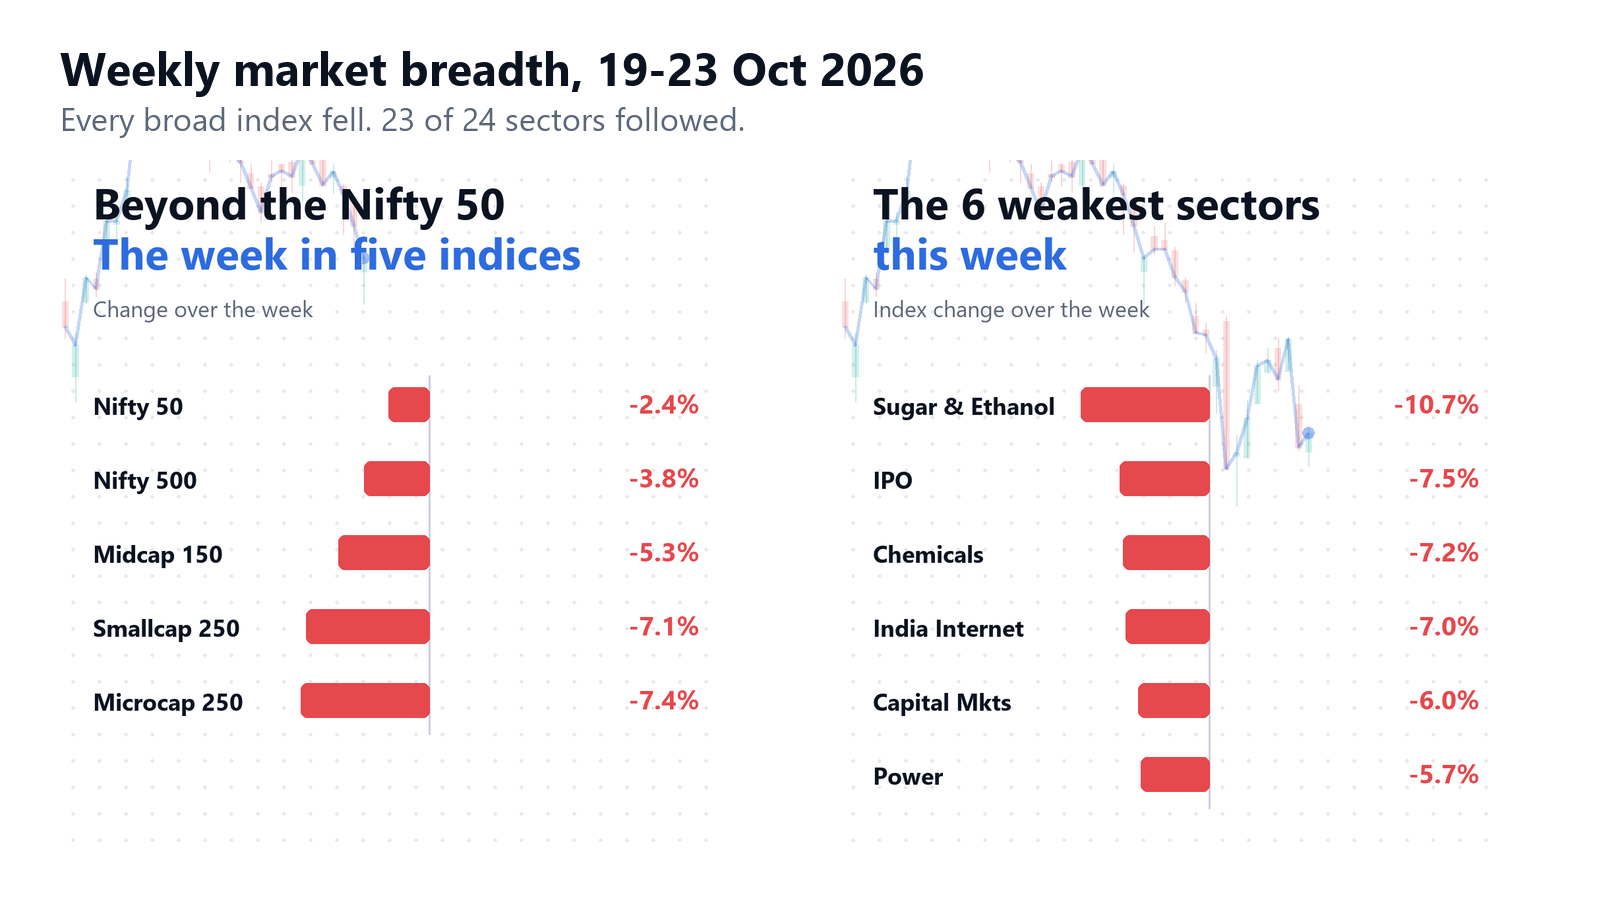
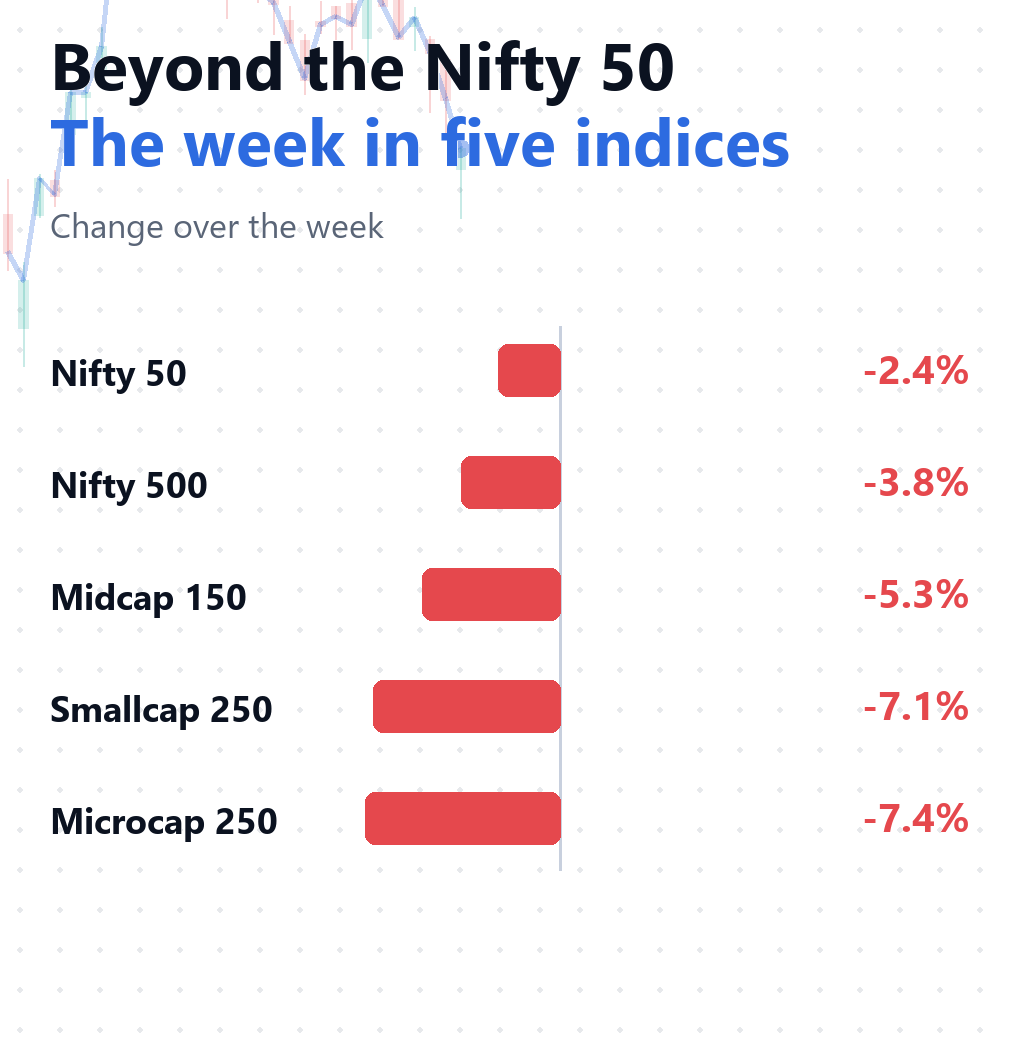
All five broad indices I follow fell in the week of 19 to 23 October 2026, and the damage grew as I moved down the market-cap ladder: the Nifty 50 lost 2.4%, the Nifty 500 3.8%, the Midcap 150 5.3%, the Smallcap 250 7.1% and the Microcap 250 7.4%. NSE was shut on 20 October for Dussehra, so this was a four-session week, measured from the 16 October close to the 23 October close. My question: is this a normal pullback, or is it spreading under the surface?
The broad indices: a bigger fall further down the cap ladder
For the Nifty 500 and the Smallcap 250, this was the biggest weekly fall in the last 26 weeks. The Nifty 50, at -2.4%, was the second worst weekly fall of that period for that index.
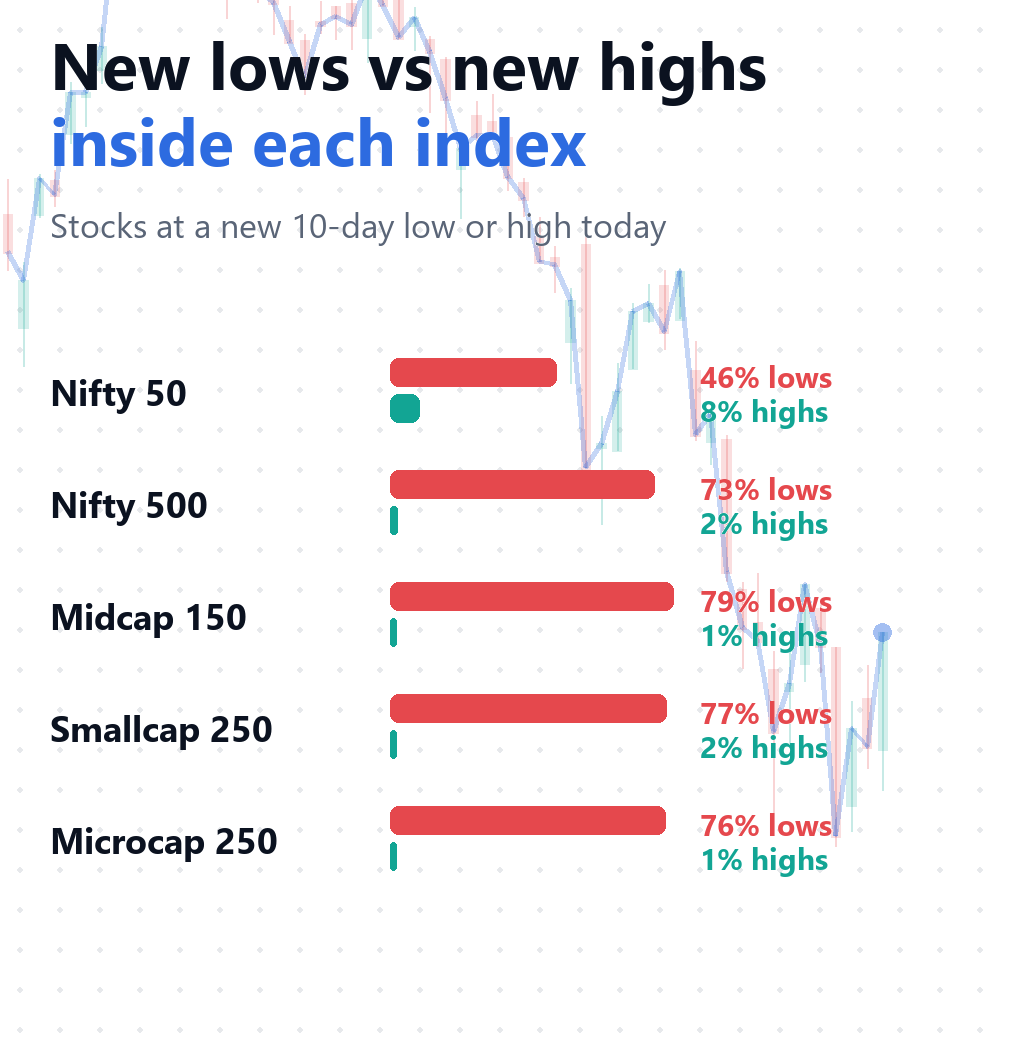
The breadth readings tell the same story, only louder. The share of stocks above their 50-day average more than halved in a week in most of these indices, and on Friday between 46% and 79% of the stocks in each index closed at a new 10-day low.
| Index | Week change | Stocks above their 50-day average | New 10-day lows / highs (Friday) | Stocks 20%+ above their 52-week low |
|---|---|---|---|---|
| Nifty 50 | -2.4% | 16% (from 30%) | 46% / 8% | 18% (March low: 24%) |
| Nifty 500 | -3.8% | 10% (from 21%) | 73% / 2% | 36% (March low: 32%) |
| Midcap 150 | -5.3% | 8% (from 17%) | 79% / 1% | 29% (March low: 32%) |
| Smallcap 250 | -7.1% | 9% (from 20%) | 77% / 2% | 38% (March low: 31%) |
| Microcap 250 | -7.4% | 6% (from 21%) | 76% / 1% | 38% (March low: 28%) |
Two things stand out. First, the Midcap 150 is where the new-low count is highest: 79% of its stocks closed at a new 10-day low on Friday, against only 1.3% at a new high. Second, the Nifty 50 holds up best on the index level and on new lows (46%), but even there only 16% of stocks are above their 50-day average, down from 30% a week earlier.
The last column is a washed-out meter: the share of stocks that trade at least 20% above their 52-week low. When that falls below 40%, it is a rare zone. All five indices are below 40% now. The Nifty 50 is at 18%, which is also below the 24.5% it showed at its March 2026 low. The Midcap 150 (29%) is also below its March reading (32%), while the Nifty 500 (36%), Smallcap 250 (38%) and Microcap 250 (38%) are still above theirs.
The sectors: 23 of 24 fell, and only IT held up
Across the 24 sectoral and thematic indices I track, 23 fell for the week and 1 rose. IT was the only gainer, at +0.2%. The weakest were Sugar & Ethanol (-10.7%), IPO (-7.5%), Chemicals (-7.2%) and India Internet (-7.0%).
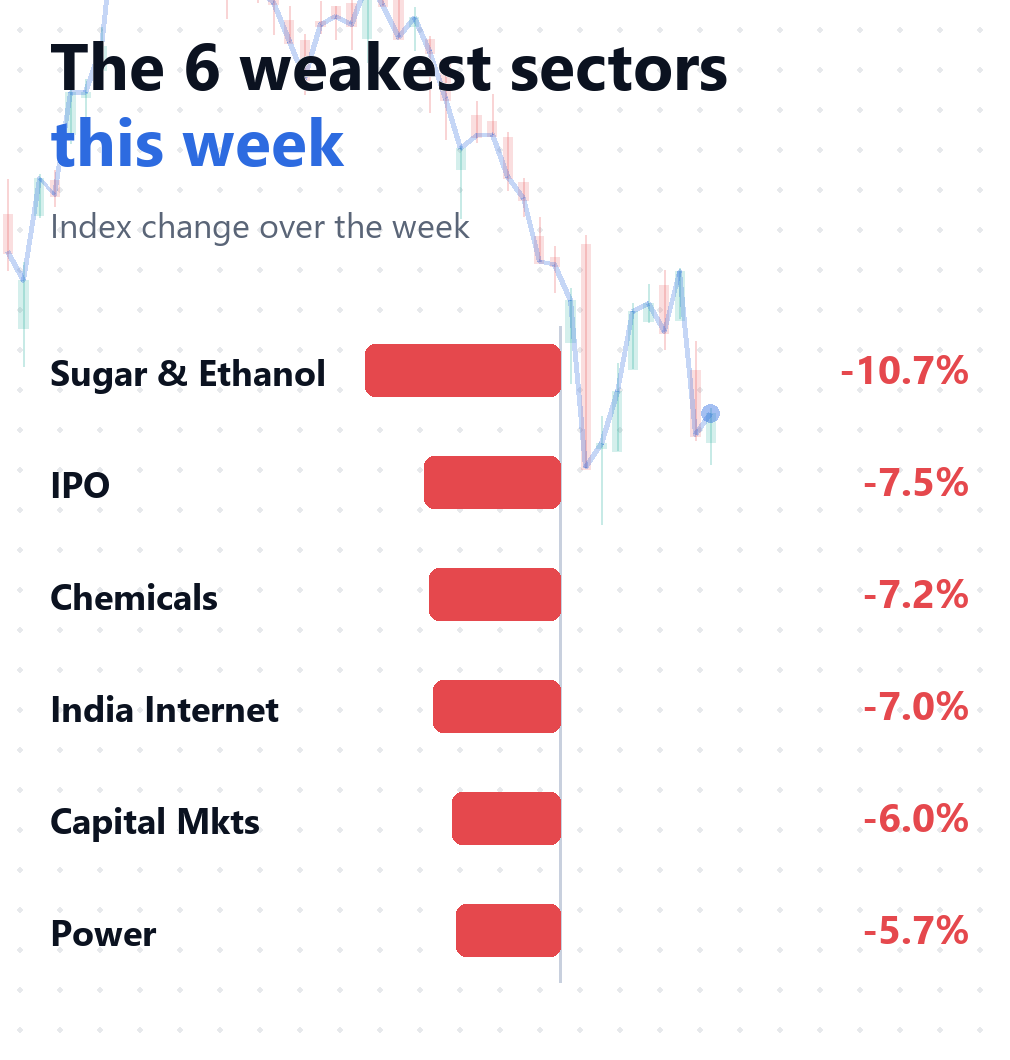
The count of stocks above their 50-day average shows how thin participation is. IT is the only sector where most stocks are above that average (8 of 10). Media has 4 of 10 and Bank has 4 of 14. In 7 sectors, none of the stocks are above their 50-day average: Auto, Chemicals, FMCG, Metal, Mobility, Power, Realty.
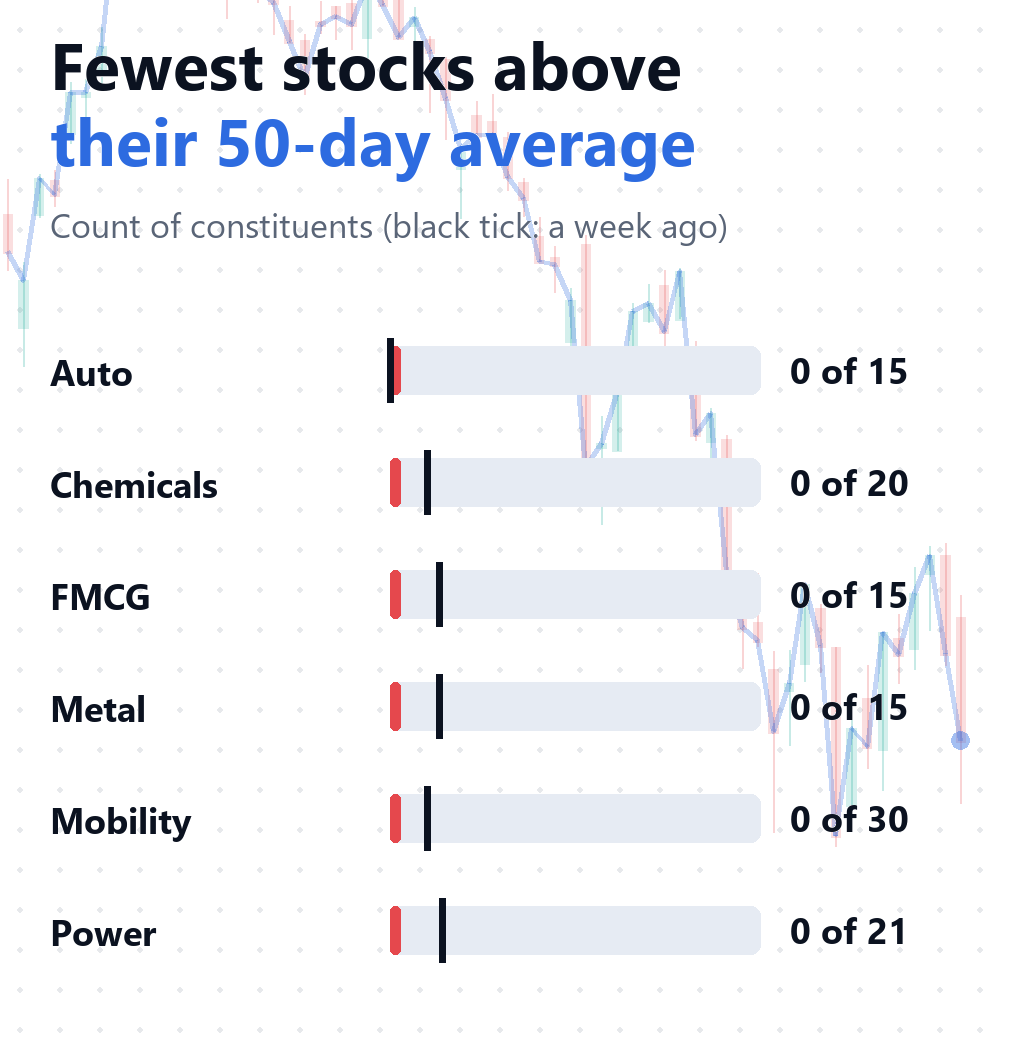
| Sector or theme | Week change | Stocks above 50-day average (23 Oct) | Share a week earlier |
|---|---|---|---|
| Sugar & Ethanol | -10.7% | 1 of 15 | 40% |
| IPO | -7.5% | 22 of 106 | 35% |
| Chemicals | -7.2% | 0 of 20 | 10% |
| India Internet | -7.0% | 3 of 26 | 46% |
| Capital Mkts | -6.0% | 1 of 17 | 24% |
| Power | -5.7% | 0 of 21 | 14% |
| New-age EV Auto | -5.5% | 2 of 38 | 8% |
| Metal | -5.4% | 0 of 15 | 13% |
| Media | -5.1% | 4 of 10 | 50% |
| Realty | -5.0% | 0 of 10 | 10% |
| New-age Consumption | -4.9% | 5 of 75 | 31% |
| Infra & Logistics | -4.7% | 6 of 100 | 16% |
| Energy | -4.6% | 1 of 40 | 15% |
| FMCG | -4.3% | 0 of 15 | 13% |
| Mobility | -3.9% | 0 of 30 | 10% |
| Fin Services | -3.7% | 3 of 20 | 35% |
| Auto | -3.5% | 0 of 15 | 0% |
| Consumption | -3.0% | 2 of 30 | 20% |
| Bank | -2.8% | 4 of 14 | 36% |
| Healthcare | -1.9% | 3 of 20 | 20% |
| Pharma | -1.8% | 3 of 20 | 25% |
| Cement | -1.1% | 1 of 16 | 6% |
| PSU Bank | -0.3% | 1 of 12 | 17% |
| IT | +0.2% | 8 of 10 | 90% |
Sugar & Ethanol is an IndexBreadth-built thematic index with daily data only. All numbers are as of the 23 October 2026 close, with the weekly change measured from 16 October.
How I read this together
This was a broad, not a narrow, week. When the Nifty 50 falls 2.4% but the Nifty 500 falls 3.8% and the Smallcap 250 falls 7.1%, the selling sits mostly outside the largest stocks. The sector table says the same: nearly every sector fell, and almost none of them has most of its stocks above their 50-day average.
The washed-out meter is the useful counterweight. All five indices sit in the rare zone below 40%, which means very few stocks are trading well above their 52-week lows. That describes where the market is. It does not tell you when, or whether, it turns.
What I am watching next
- Whether new 10-day lows fall back from 76-79% in the Midcap 150, Smallcap 250 and Microcap 250.
- The share of stocks above their 50-day average in the Nifty 500 (9.6% now). A turn up from here would be the first sign that selling is fading.
- Whether IT, the one sector with most stocks above the 50-day average, keeps that participation or joins the others.
- The Nifty 50 washed-out reading (18%), which is below its March low reading.
Questions
What does “stocks above the 50-day average” measure? It is the percentage of an index’s stocks trading above their own 50-day average price. A low number means few stocks are in an intermediate-term uptrend.
What is a new 10-day low? It is a stock closing below the lowest close of its previous 10 sessions. The percentage shows how many stocks in the index did that on the same day.
Is a washed-out reading a signal to buy? No. It describes how many stocks trade near their 52-week lows. It does not predict what happens next.
This is market context for study, not a signal to buy or sell.
Start your free IndexBreadth trial to follow these breadth readings across NSE universes every day.
Lovelesh Sharma
SEBI Registered RA
INH000027937
CMT, CFTe
The views expressed are for educational purposes only and do not constitute investment advice.
Tags: #MarketBreadth #WeeklyWrap #Nifty500 #Smallcap #Sectors #NewLows