Nifty 500 Breadth, 12 Oct 2026: Negative MACD, New 52-Week Lows and Elevated Volatility
Price is stabilising, but momentum, 52-week lows and volatility readings have not turned.
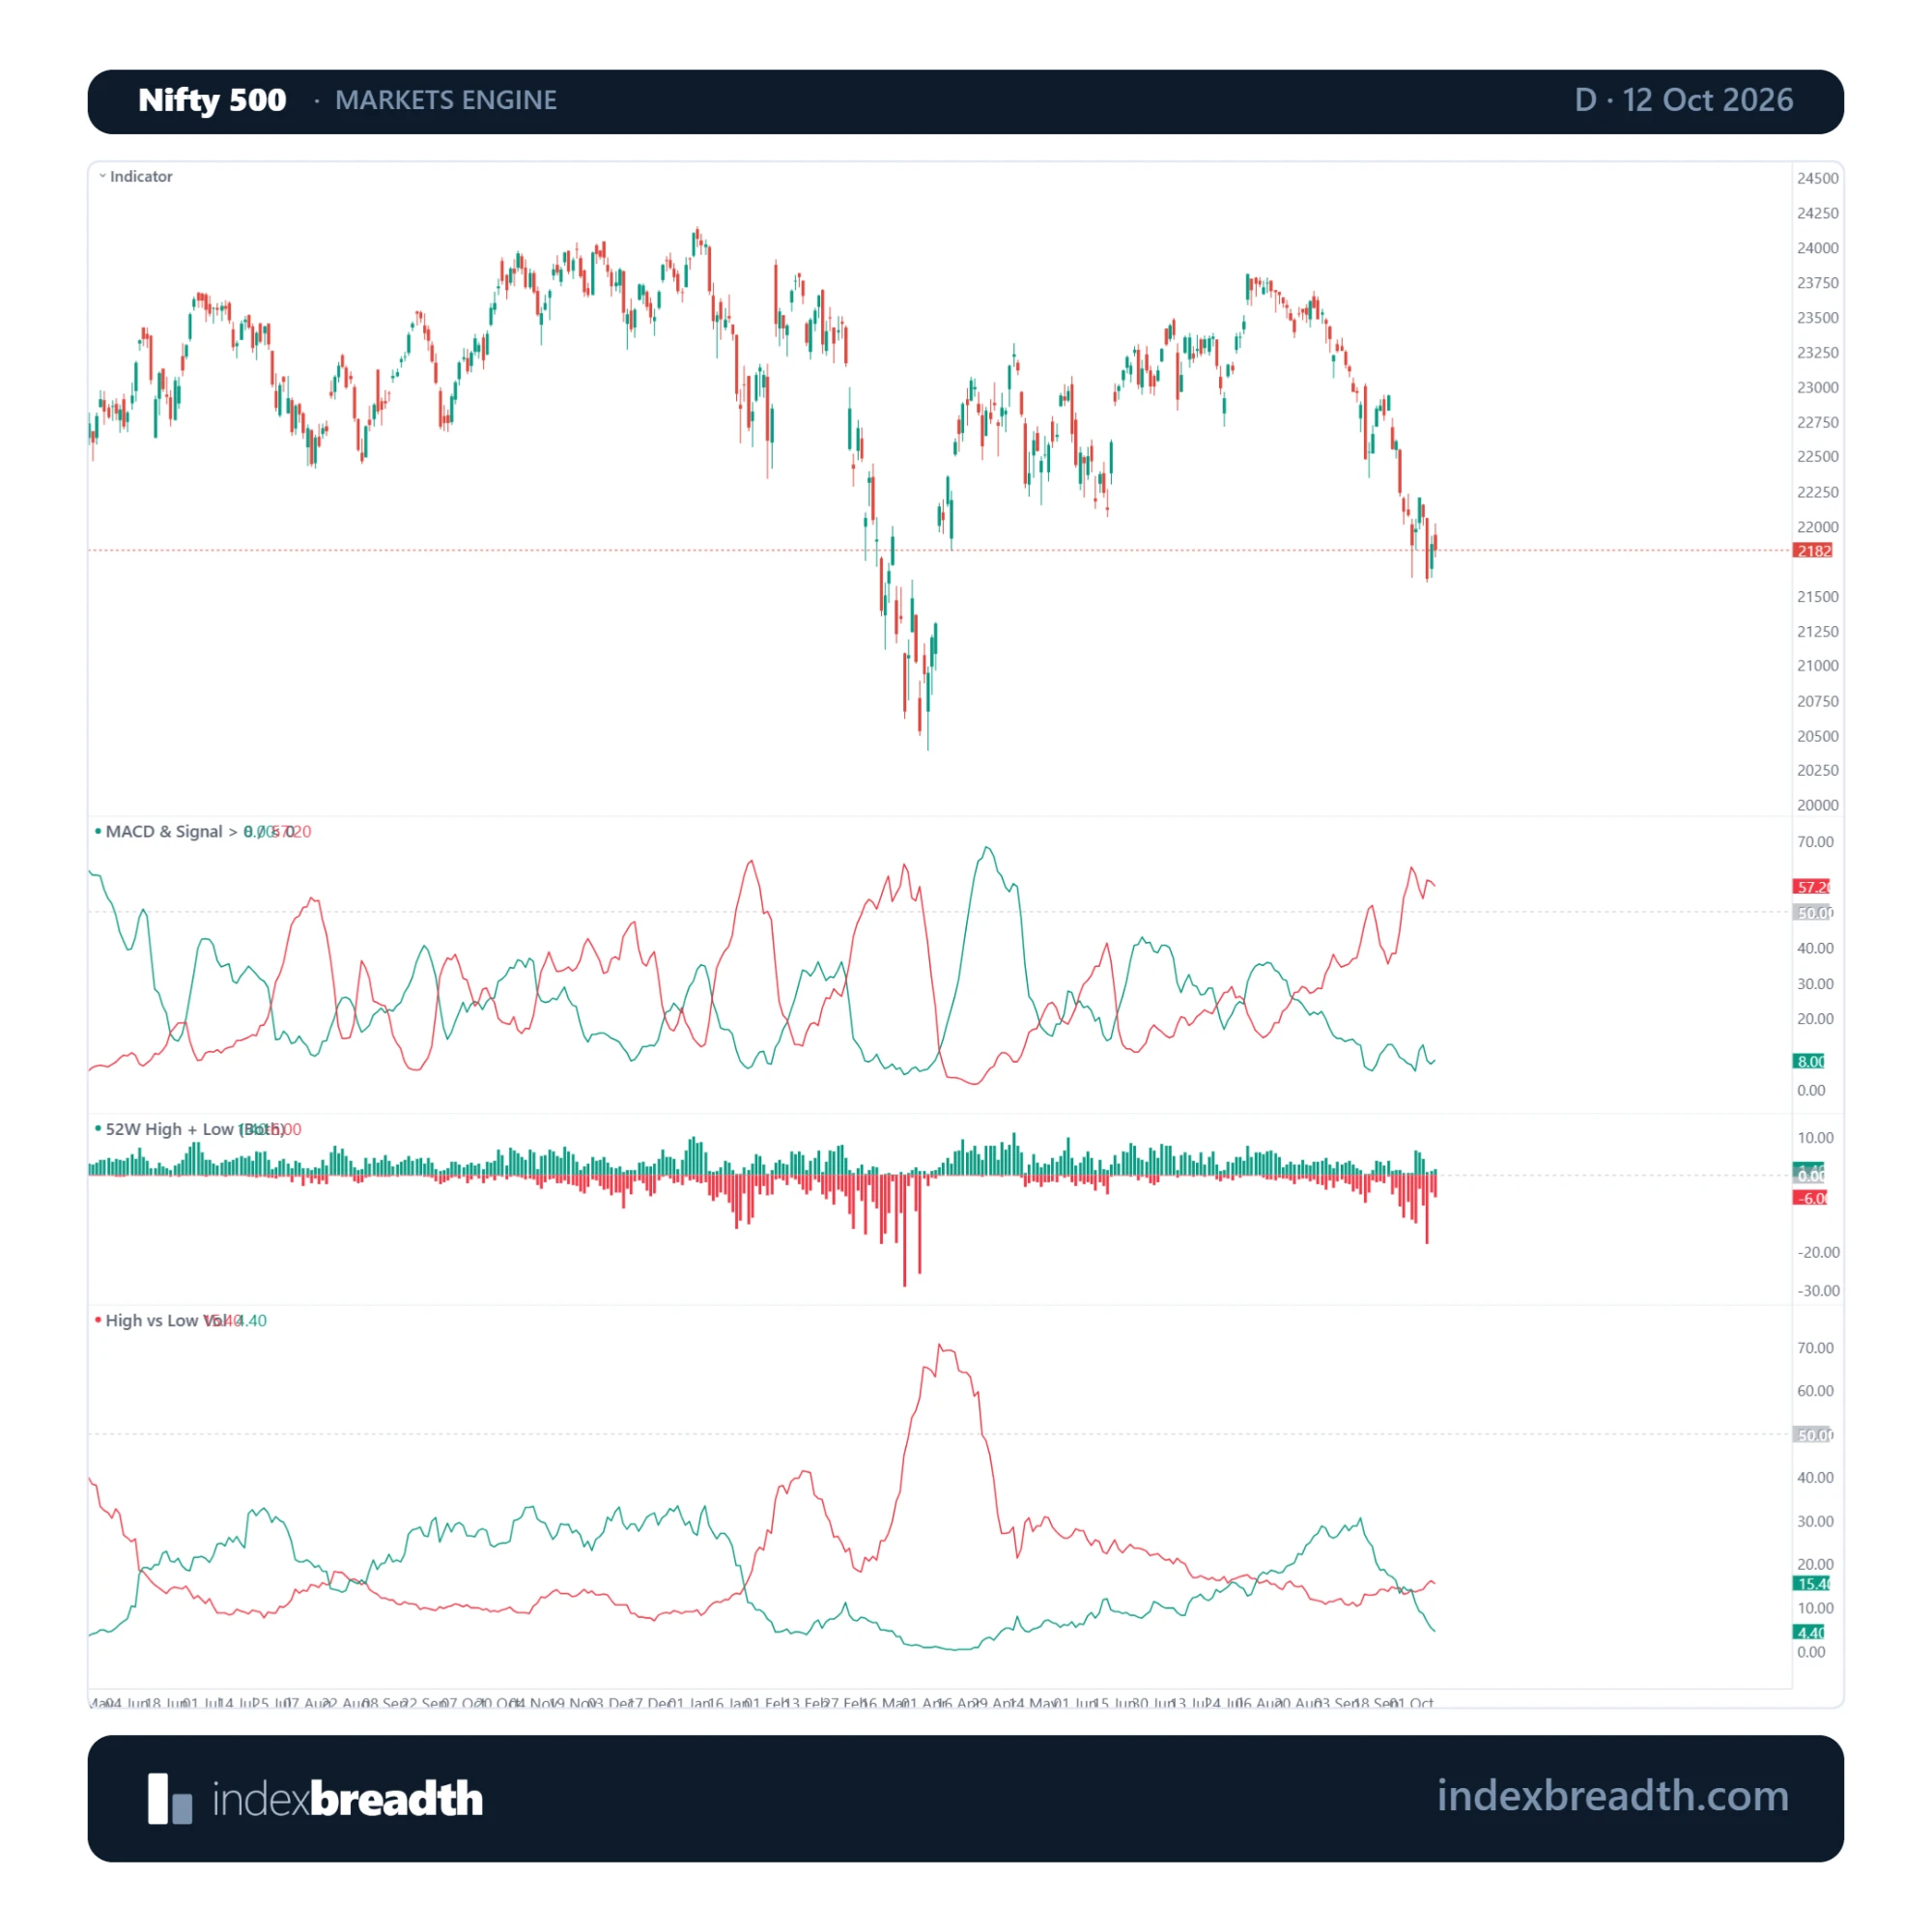
The Nifty 500 is trying to stabilise near its recent lows, but the breadth readings underneath are still telling a cautious story. On 12 October, 273 stocks advanced and 226 declined, a much calmer session than last week. Five readings explain why I am not calling this repaired yet: MACD, 52-week lows, volatility, advances and declines, and index contribution.
Negative MACD is still elevated
The first pane tracks MACD across the Nifty 500 stocks. The share of stocks with a negative MACD sits near 57%, in the upper part of its range on the chart. The group with a positive reading is down around 8%.
MACD is a trend-momentum measure. When a big share of the basket is negative, most stocks are still in a downward momentum phase, even when the index has a better day. A bounce can happen inside that phase. A change of phase looks different: the negative share starts to fall and the positive share starts to build.
New 52-week lows are still expanding
The second pane shows the share of stocks making new 52-week highs and lows. Over the last six sessions, new lows averaged about 9% of the Nifty 500, with a peak of 18.2% on 8 October. New highs averaged about 3%.
On 12 October, 6.0% of stocks closed at a new 52-week low, against 1.4% at a new high. The number is lower than the spike on 8 October, so the pressure has eased a little. But lows are still outnumbering highs by more than four to one, and the bars on the chart show the lower side expanding through recent weeks.
I would call this an expansion stage for lows. The lows have not yet been absorbed. For me, the sign that they are would be a run of sessions where the new-low share stays below the new-high share.
Volatility: high is still above low
The third pane compares stocks in a high-volatility state with stocks in a low-volatility state. Today the high-volatility group is 15.4% of the basket and the low-volatility group is only 4.4%.
The gap has been widening. Five sessions ago the two were closer, at about 13.4% high and 11.0% low. Since then the high group has crept up while the low group has shrunk by more than half. That is a short, plain sign of elevated volatility: more stocks are making large moves, and fewer are sitting quietly.
Advances and declines: decliners keep the upper hand in the Nifty 50
The count of advancing and declining stocks tells the same story. In the Nifty 50, 13 stocks closed higher and 36 lower on 12 October. In the live view late in the session it was 10 against 40 (the Index Analytics screen), with the index about 0.9% lower at that point. The index closed at 22,363, down about 0.7%.
Decliners also outnumbered advancers on five of the last eight sessions in the Nifty 50: 30 September, 1 October, 7 October, 8 October and 12 October. The one big green day, 9 October, was 46 advancers against 4 decliners, and it did not carry over.
The Nifty 500 was calmer, with 273 advancers and 226 decliners. So the wider basket held up better than the 50 largest stocks, which is why the large-cap index looks heavier.
Index contribution: a few heavy names did most of the damage
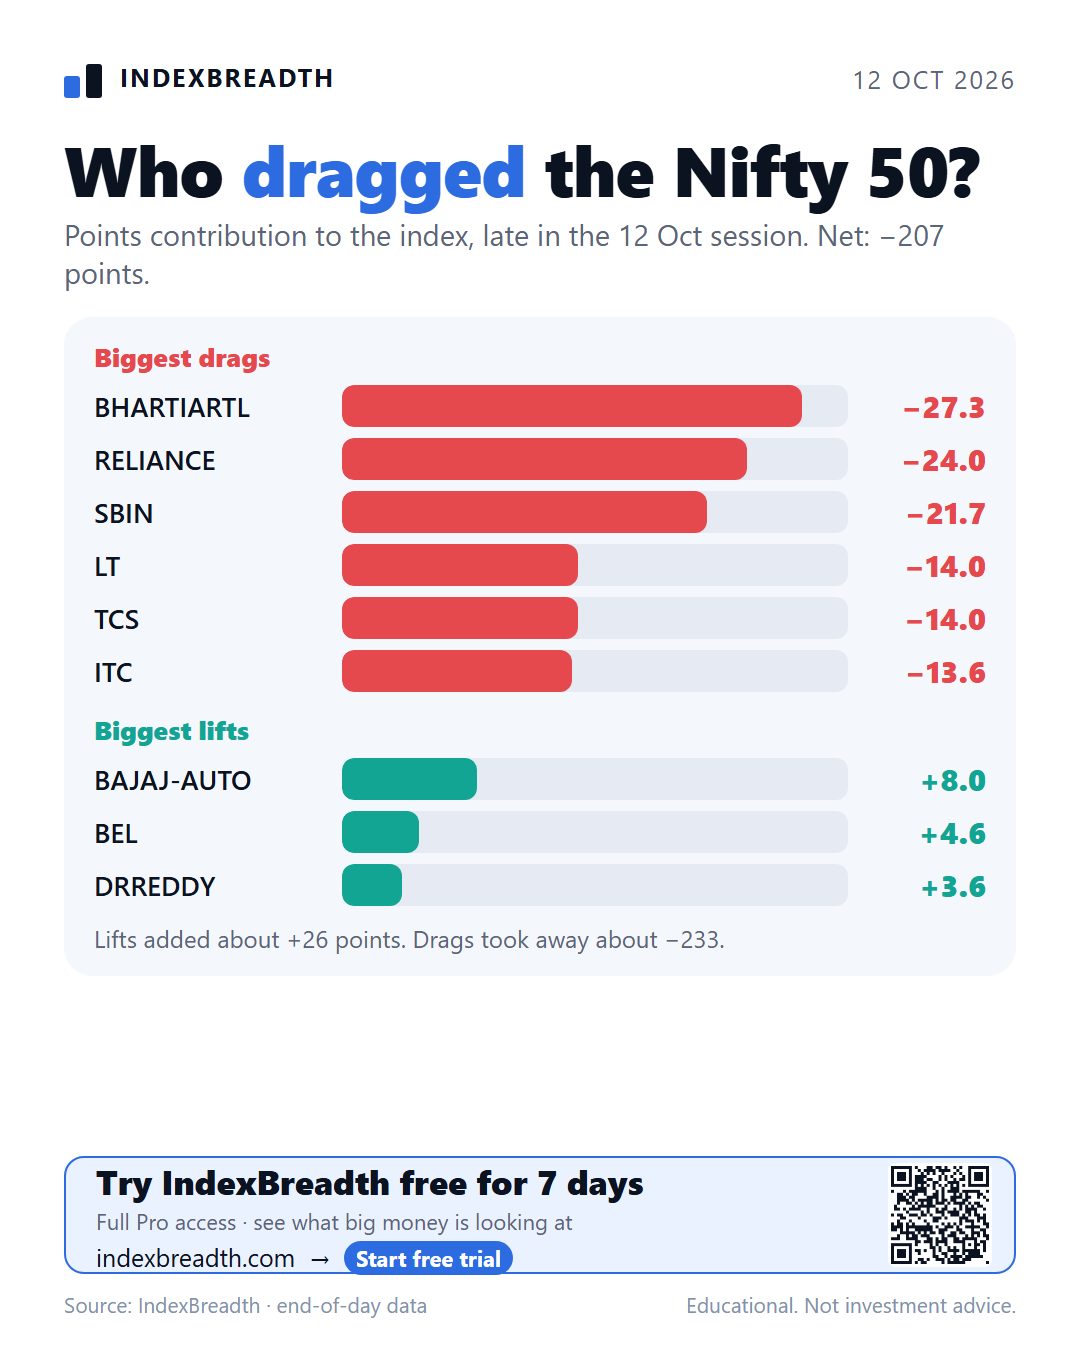
The Nifty 50 points contribution shows who moved the index, and it was lopsided late in the session. Gainers added about 26 points, while decliners took away about 233, for a net drop of roughly 207 points.
The biggest drags were Bharti Airtel (about -27 points), Reliance (-24), SBI (-22), L&T (-14), TCS (-14) and ITC (-14). The biggest lifts were Bajaj Auto (+8), BEL (+4.6) and Dr Reddy’s (+3.6).
On the 10-day view of the contributions chart, the cumulative points from decliners are about 826 against about 175 from gainers. That is close to a five to one imbalance. A handful of heavy stocks falling together can pull the index down even when the wider market is calmer, so I read the points contribution and the advance-decline count side by side.
How I read this together
| Reading (Nifty 500) | Latest | What it says |
|---|---|---|
| Advances vs declines, Nifty 500 | 273 : 226 | A calmer day after a sharp week |
| Advances vs declines, Nifty 50 | 13 : 36 | Decliners still in charge in the 50 |
| Nifty 50 points contribution (late session) | about -207 | A few heavy names did most of the damage |
| Stocks with negative MACD | about 57% | Downward momentum still widespread |
| New 52-week lows | 6.0% | Easing from 18.2% on 8 Oct, still above highs |
| New 52-week highs | 1.4% | Very few stocks at the top of their range |
| High volatility group | 15.4% | Rising over six sessions |
| Low volatility group | 4.4% | Down from 11.0% six sessions ago |
My read: stabilising price, but breadth has not turned. Momentum is still weak across the basket, lows are still expanding, and volatility is elevated. A better day does not change that picture on its own.
What I am watching next
- The share with negative MACD rolling over, and the positive group growing from its low base.
- New 52-week lows staying below new highs for several sessions in a row.
- The high-volatility group falling back while the low-volatility group rebuilds.
- Advancers outnumbering decliners in the Nifty 50 for more than one session.
- The heavy drags (telecom, energy, banks) stopping their points loss.
- Price holding its recent low while these three readings improve together.
This is market context for study, not a signal to buy or sell.
Start your free IndexBreadth trial to follow these breadth readings across NSE universes every day.
Lovelesh Sharma
SEBI Registered RA
INH000027937
CMT, CFTe
The views expressed are for educational purposes only and do not constitute investment advice.
Tags: #MarketBreadth #Nifty500 #MACD #New52WeekLows #Volatility #IndexBreadth #DailyBreadth