Is the Bounce Healthy or Shallow? What the Data Shows
Oversold stocks are clearing, but participation above the 20-day average is still thin.
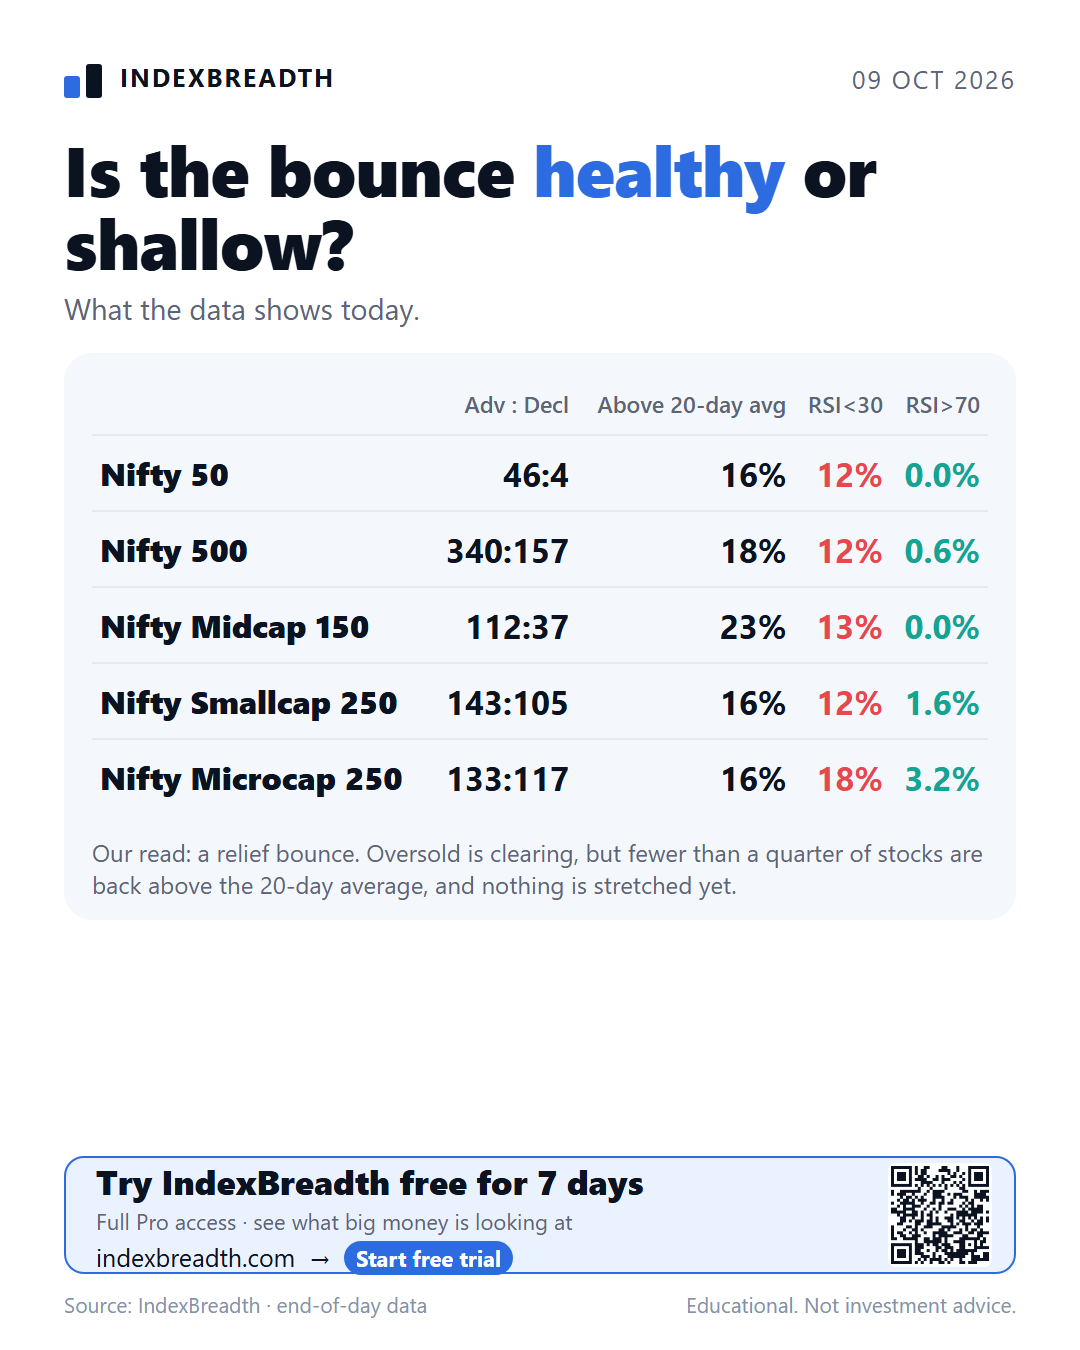
Nifty 500 had 340 advancers against 157 decliners on 9 October. That is a proper bounce. The question I care about is whether it is the start of something healthy or just a shallow relief move after a hard week.
I looked at two views in the IndexBreadth rolling comparison: the daily table, compared with five sessions ago, and the hourly table, compared with 20 bars ago. Both cover the Nifty 50, Nifty 500, Midcap 150, Smallcap 250 and Microcap 250.
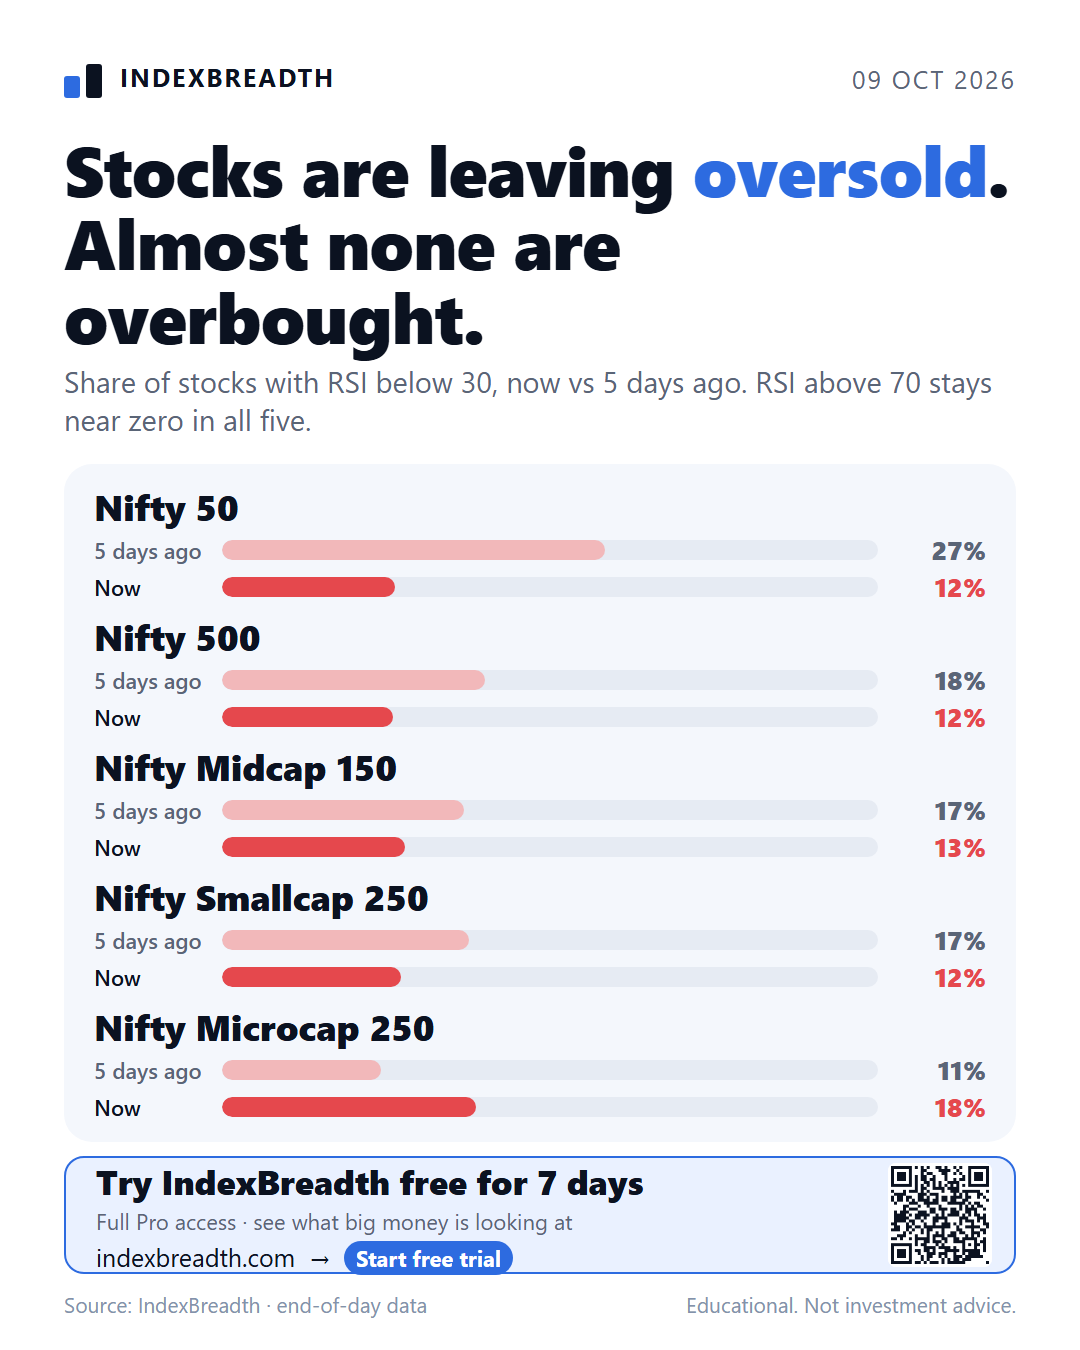
Stocks are leaving oversold, and nobody is overbought
The first thing that stands out is the RSI below 30 group. Five sessions ago, 18.2% of the Nifty 500 was below 30. Today it is 11.8%. The Nifty 50 moved from about 26.5% to 12%, Midcap 150 and Smallcap 250 both fell by around four to five points.
At the other end, almost nothing is stretched. The share of stocks above RSI 70 is 0% in the Nifty 50 and Midcap 150, 0.6% in the Nifty 500, 1.6% in Smallcap 250 and 3.2% in Microcap 250.
So the selling pressure has eased, but no one is chasing yet. I read that as a market that is recovering from a washout, not one that is running hot.
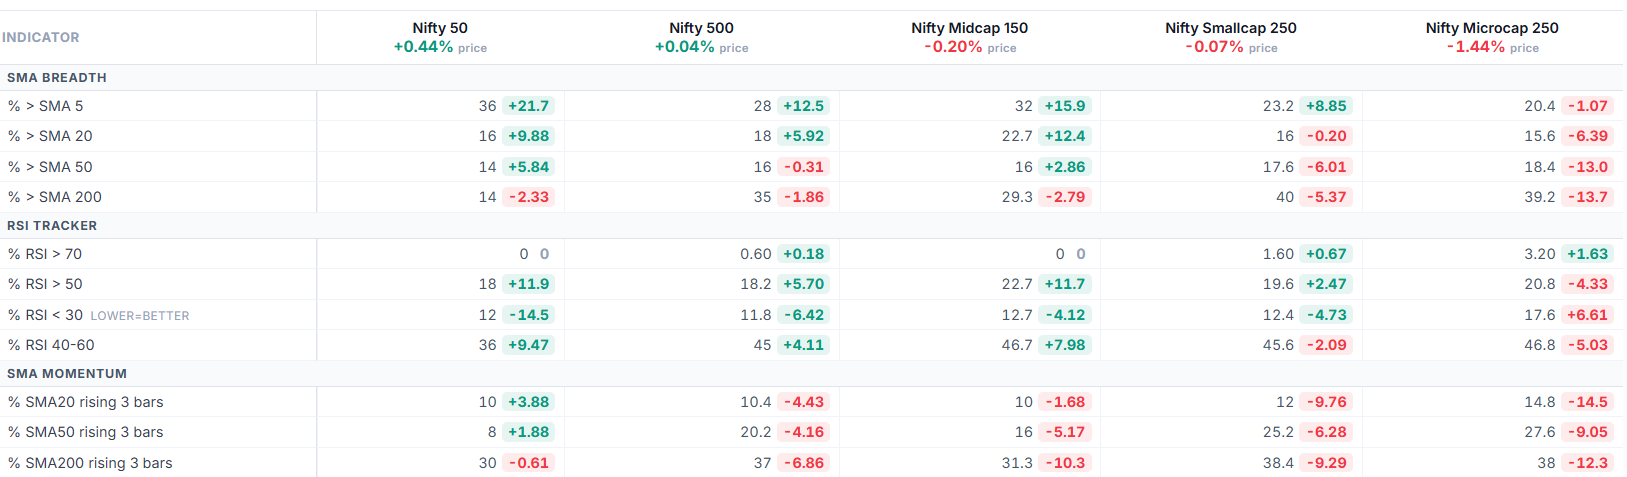
The daily table: short averages recover, longer ones do not
| Share of stocks | Nifty 50 | Nifty 500 | Midcap 150 | Smallcap 250 | Microcap 250 |
|---|---|---|---|---|---|
| Above 5-day average | 36% | 28% | 32% | 23.2% | 20.4% |
| Above 20-day average | 16% | 18% | 22.7% | 16% | 15.6% |
| Above 50-day average | 14% | 16% | 16% | 17.6% | 18.4% |
| Above 200-day average | 14% | 35% | 29.3% | 40% | 39.2% |
| RSI below 30 | 12% | 11.8% | 12.7% | 12.4% | 17.6% |
| RSI above 70 | 0% | 0.6% | 0% | 1.6% | 3.2% |
Look at how the picture changes as the average gets longer. The share above the 5-day average rose sharply in the larger universes: +21.7 points in the Nifty 50, +12.5 in the Nifty 500, +15.9 in Midcap 150. That is a quick bounce.
But the share above the 20-day average is still only 16% to 23%, and the 50-day and 200-day readings barely moved or fell. In the Nifty 50, the share above the 200-day average is just 14%.
The smaller end is the weakest part. Microcap 250 is the one universe where RSI below 30 went up over five sessions, from about 11% to 17.6%, and its share above the 50-day average fell by 13 points. Smallcap 250 shows the same direction on the longer averages, just less sharply.
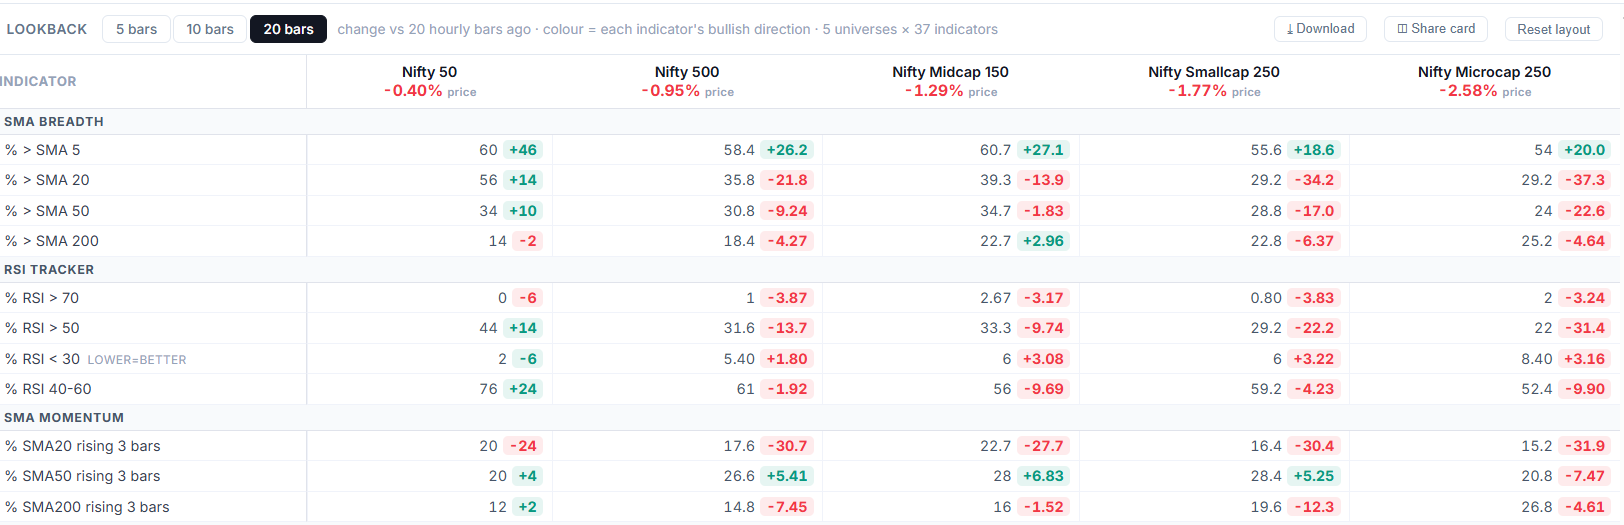
The hourly table: a fast move, not a repaired trend
On the 20-bar hourly view, the share of stocks above the 5-bar average jumped everywhere, from 54% to 61%. That matches the daily bounce.
The longer picture is less friendly. The share above the 20-bar average is down by 14 to 37 points in the Nifty 500, Midcap, Smallcap and Microcap, and sits at 29% to 39%. The share with RSI above 50 fell by 10 to 31 points in the same four. Only the Nifty 50 held up, with RSI above 50 at 44%, up 14 points.
Price tells the same story. Over those 20 hourly bars the Nifty 50 is down 0.40%, the Nifty 500 down 0.95%, and the smaller universes down more, with Microcap 250 down 2.58%.
So, healthy or shallow?
My read today: shallow so far, though not a failed bounce.
- What is healthy: oversold is clearing in most universes, and there is no overbought crowd to unwind.
- What is missing: fewer than a quarter of stocks are back above their 20-day average, the longer averages are not improving, and the smaller universes are lagging the large caps.
- The comparison: on 6 October the Nifty 500 had 365 advancers, and the share above the 20-day average reached about 25%. Within two sessions it faded. Today’s breadth is a little weaker than that day.
What I am watching next
- The share above the 20-day average moving past 30% in the Nifty 500, and holding for more than a day.
- Smallcap and Microcap RSI below 30 turning down, instead of staying near 12% to 18%.
- The 50-day readings stopping their slide, especially in the smaller universes.
- RSI above 70 starting to rise from near zero. That would show buyers actually leaning in.
A bounce that does these things looks healthier. One that does not has the same shape as the 6 October rally. This is market context for study, not a signal to buy or sell.
Start your free IndexBreadth trial to follow these readings across NSE universes every day.
Lovelesh Sharma
SEBI Registered RA
INH000027937
CMT, CFTe
The views expressed are for educational purposes only and do not constitute investment advice.
Tags: #MarketBreadth #RSIBreadth #Nifty500 #Nifty50 #StocksAboveMovingAverages #IndexBreadth #DailyBreadth