Combining Breadth Indicators Without Double-Counting
A transparent arithmetic example before any advanced model.
It is tempting to combine several breadth readings into one number. Would that number add information, or simply repeat the same evidence in a more complicated form?
I think that is the first advanced question to ask. A composite can be convenient, but convenience is not validation. This lesson uses a fully disclosed, arbitrary educational example—not an IndexBreadth score or a tested trading model.
Start with visible, defined inputs
Let X be the percentage of eligible stocks above a 50-session average. Let Y be the percentage above a 200-session average, using matched universe and observation conventions.
Both inputs are between zero and 100. The underlying percentage is qualifying count divided by eligible count, multiplied by 100. If that step is unclear, read why the denominator matters first.
For a purely illustrative composite, choose non-negative weights w1 and w2 that sum to one:
S = w1 × X + w2 × Y.
This is ordinary weighted-sum arithmetic; NIST documents the general weighted-sum definition. The choice of inputs and weights below is ours for teaching, not a published trading prescription.
A transparent worked example
Suppose a fully eligible 100-stock basket has 70 stocks above their 50-session average and 40 above their 200-session average. Then X = 70 and Y = 40.
With equal weights, S = 0.5 × 70 + 0.5 × 40 = 55.
Now give the longer-horizon input twice the weight of the shorter-horizon input:
S = (1/3 × 70) + (2/3 × 40) = 50.
The stocks did not change. Only the weights did. A five-point difference in the composite is therefore not necessarily new market information.
What double-counting looks like
The same stocks may qualify for both moving-average conditions. Two high readings do not represent two independent groups of evidence. If we add a third input that is just X again, an equal-weight three-input average becomes (70 + 40 + 70)/3 = 60.
That change has effectively increased the weight on X. It has not discovered another source of confirmation.
The issue can be less obvious when indicators have different names but are strongly related transformations of the same underlying observations. I would inspect their definitions before counting how many indicators agree.
Scaling is necessary, not sufficient
A raw cumulative A/D line cannot be averaged meaningfully with a bounded percentage merely because both appear on charts. Their units and starting-point conventions differ. Any transformation to a common scale needs to be explained and tested.
Even our bounded example loses detail. X = 70 and Y = 40 gives the same equal-weight score as X = 40 and Y = 70, although their short- and long-horizon participation stories differ. I would keep the components visible rather than rely on the combined number alone.
What I would require before practical use
A serious model needs fixed definitions, point-in-time data, treatment of missing inputs, an out-of-sample test, and a clear account of failures. A high in-sample fit after trying many weights is not convincing evidence by itself.
We believe advanced work should make assumptions easier to inspect. On IndexBreadth, interpret published labels and available views without reverse-engineering private scores. This example teaches public arithmetic only; its values are not buy/sell thresholds, probabilities or performance claims.
Reading the IndexBreadth charts
Before combining signals, I would put the component charts beside each other. These IndexBreadth views show 20/50/200 participation together and in separate panels. They illustrate the component relationships; the hypothetical composite calculation earlier in this lesson remains a separate example.
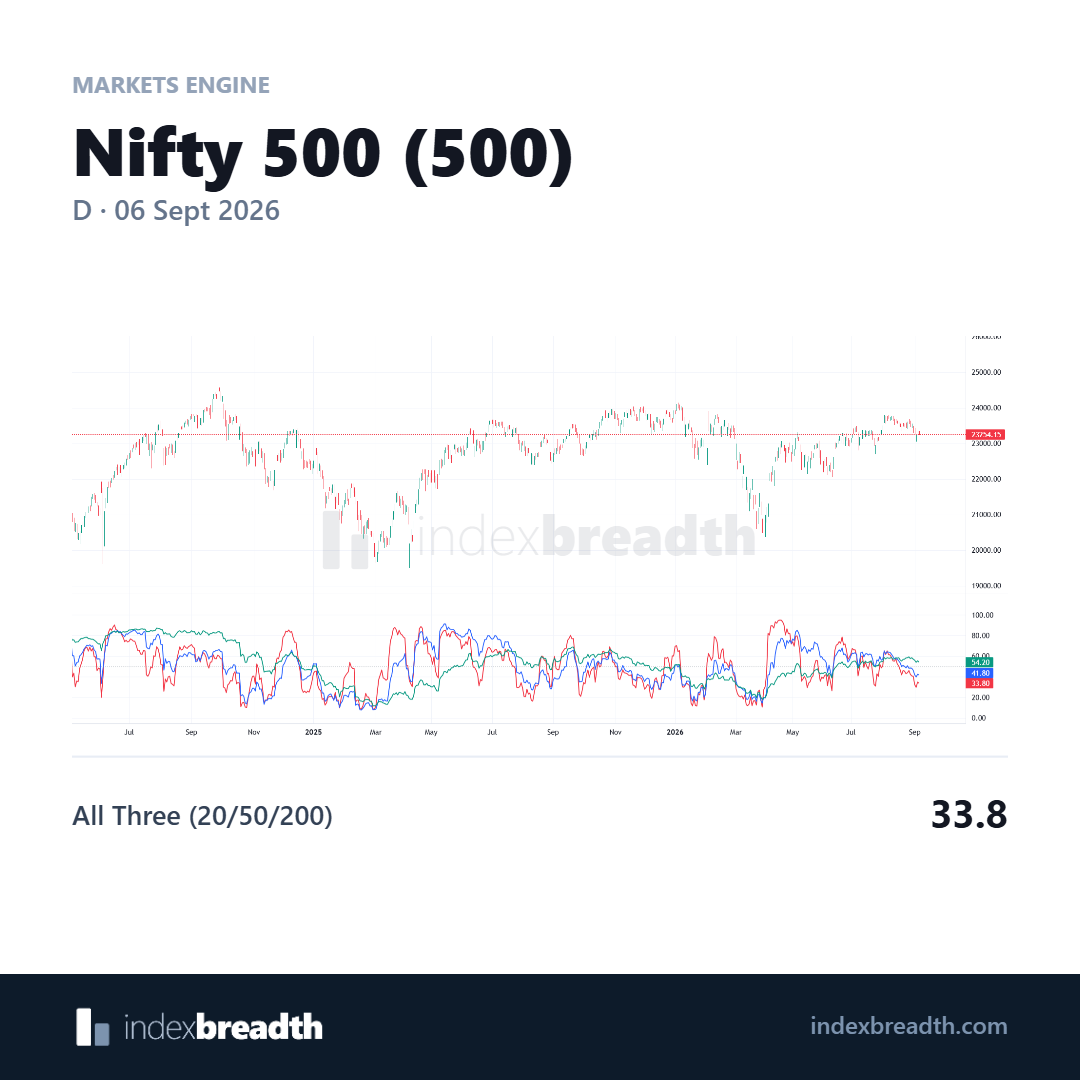
The combined view puts three participation horizons on one chart.
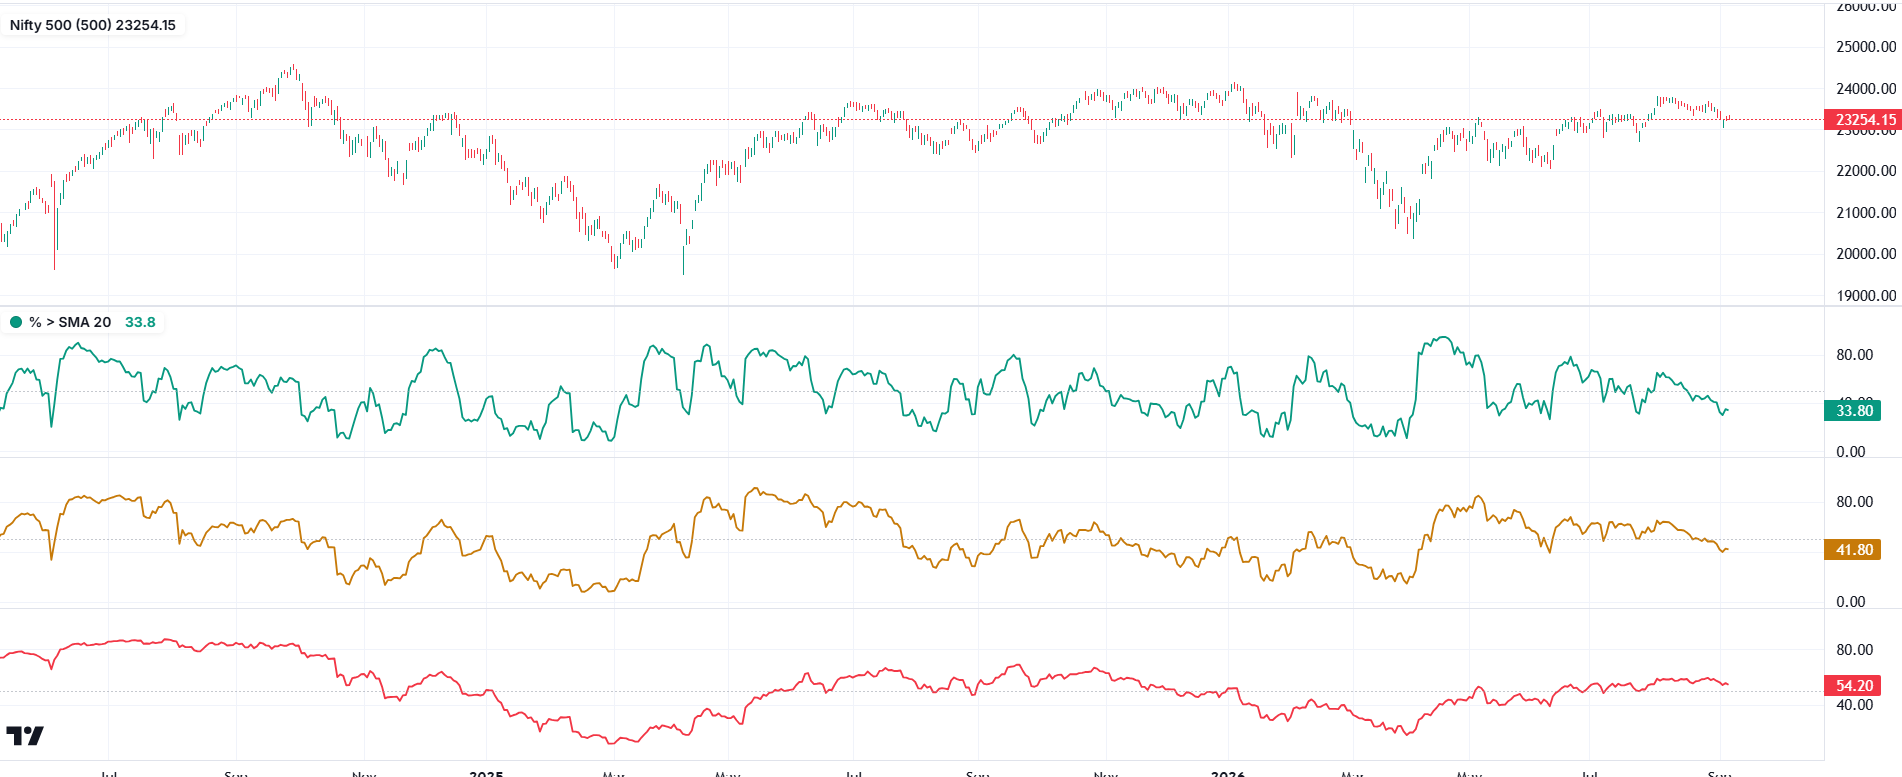
Separate panels make the individual paths easier to compare. Similar movement is a reason to check overlap before giving each component a separate vote.
Charts: IndexBreadth. Select an image to view it at full size. These are historical illustrations, separate from the worked numerical examples in this lesson.